Materials › Paints, Varnishes, Lacquers, Enamels And Allied Products

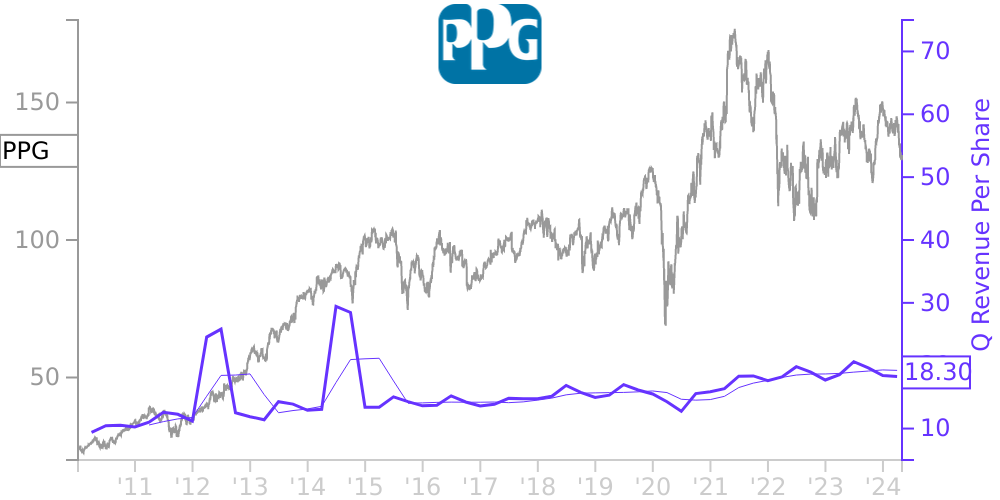
PPG Stock Price Correlated With PPG Industries Financials
External Links ⌄
Income Statement
Cash Flow
Balance Sheet
PPG Income Statement
Enable JavaScript and reload
Revenue, Net:
Cost of Goods & Services Sold:
Gross Profit:
Selling, General & Admin Expense:
Research & Development Expense:
Total Operating Expenses:
Operating Income:
Income Taxes:
Net Income:
PPG Cash Flow
Enable JavaScript and reload
Operating Activities Net Income:
Depreciation, Depletion & Amortization:
Change in Accounts Receiveable:
Net Cash from Operations:
Repurchases/Buybacks Common Stock:
Issuance of Long-term Debt:
Cash Dividends Paid:
Net Cash from Financing Activities:
Property, Plant & Equipment Purchases:
Purchases of Businesses, Net of Cash:
Net Cash from Investing Activities:
Net Change in Cash & Equivalents:
PPG Balance Sheet
Enable JavaScript and reload
Cash and Cash Equivalents:
Short-Term Investments:
Accounts Receivable, Net:
Inventories:
Total Current Assets:
Property, Plant & Equipment, Net:
Total Assets:
Accounts Payable:
Current Portion of Long-Term Debt:
Total Short-Term Liabilities:
Long Term Debt, Non-Current Portion:
Total Long-Term Liabilities:
Total Liabilities:
COMPANY PROFILE
Basis of Presentation The condensed consolidated financial statements included herein are unaudited and have been prepared following the requirements of the Securities and Exchange Commission (the "SEC") and accounting principles generally accepted in the United States of America ("U.S. GAAP") for interim reporting. Under these rules, certain footnotes and other financial information that are normally required for annual financial statements can be condensed or omitted. These statements include all adjustments, consisting only of normal, recurring adjustments, necessary for a fair presentation of the financial position and shareholders' equity of PPG as of June 30, 2022 and the results of its operations and cash flows for the three and six months ended June 30, 2022 and 2021. All intercompany balances and transactions have been eliminated. Material subsequent events are evaluated through the report issuance date and disclosed where applicable. These condensed consolidated financial statements should be read in conjunction with the consolidated financial statements and notes included in PPG's 2021 Annual Report on Form 10-K (the "2021 Form 10-K").
Net sales, expenses, assets and liabilities can vary during each quarter of the year. Accordingly, the results of operations for the three and six months ended June 30, 2022 and the trends in these unaudited condensed consolidated financial statements may not necessarily be indicative of the results to be expected for the full year.
Net sales, expenses, assets and liabilities can vary during each quarter of the year. Accordingly, the results of operations for the three and six months ended June 30, 2022 and the trends in these unaudited condensed consolidated financial statements may not necessarily be indicative of the results to be expected for the full year.
Free historical financial statements for PPG Industries Inc. See how revenue, income, cash flow, and balance sheet financials have changed over 56 quarters since 2010. Compare with PPG stock chart to see long term trends.
Data imported from PPG Industries Inc SEC filings. Check original filings before making any investment decision.