Visual Fundamental Analysis and Insider Buying for S&P 500 and Russell 2000
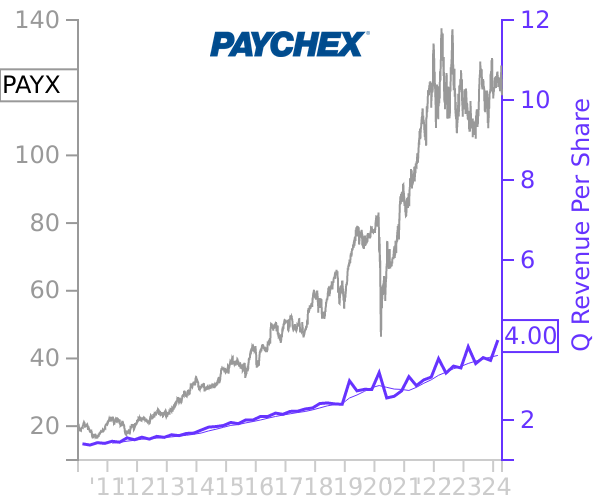
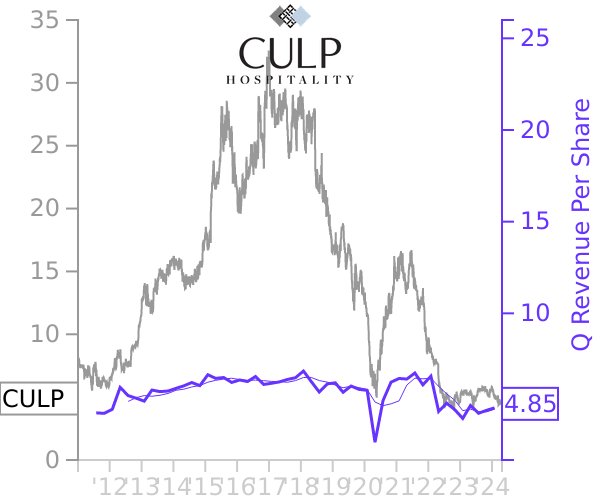
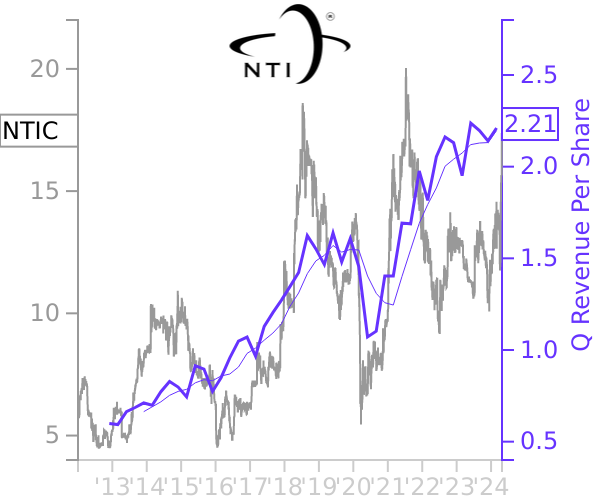
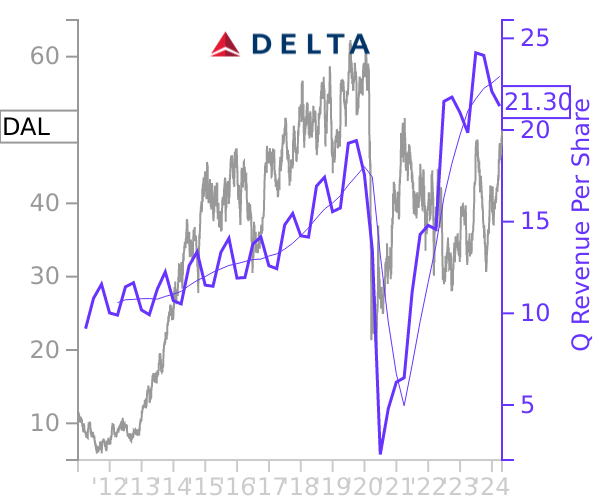
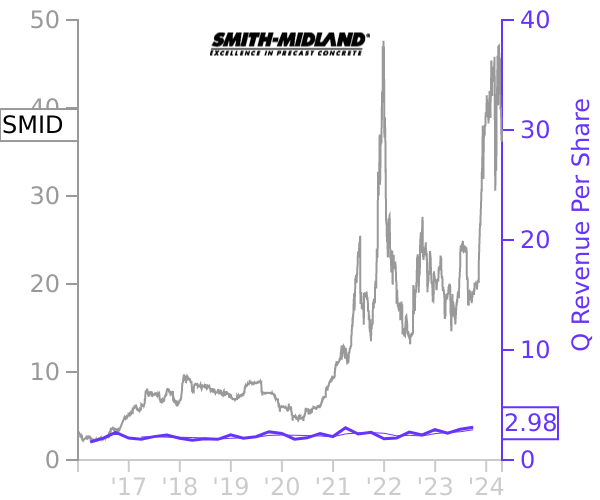
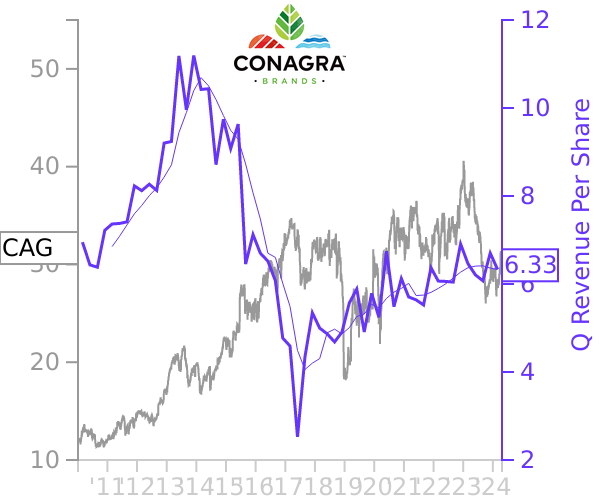
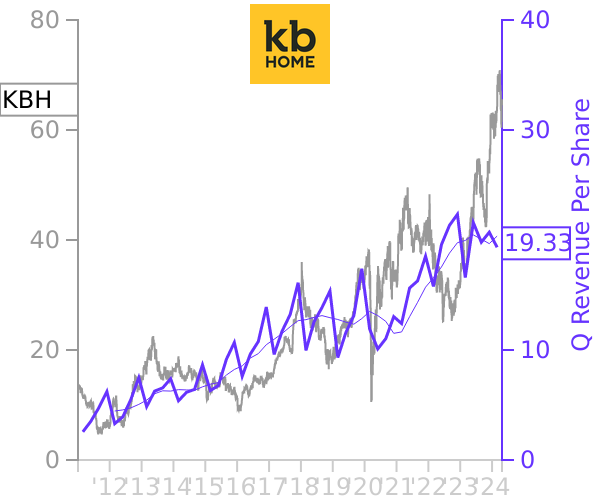
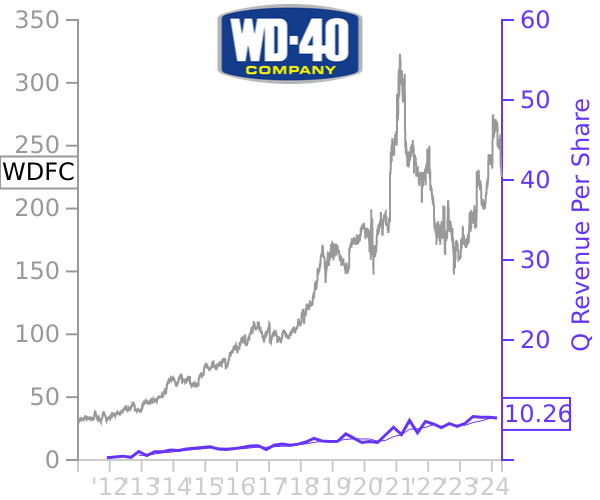
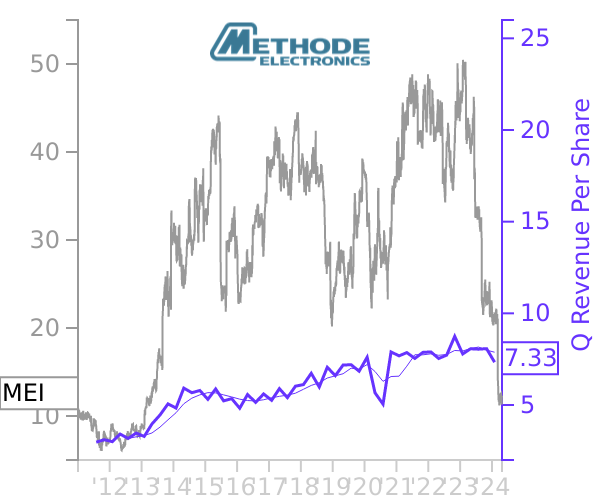
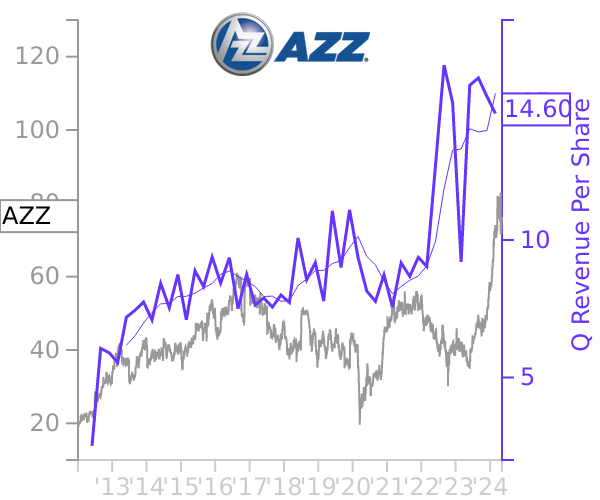
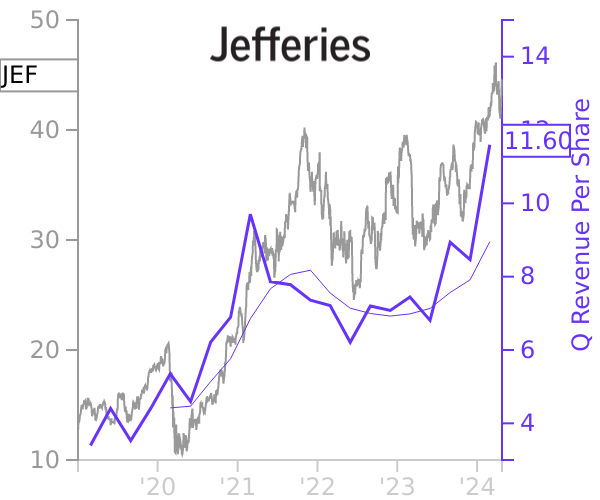
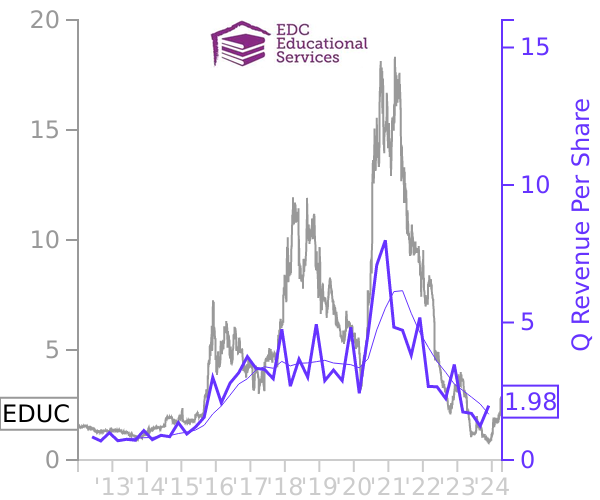
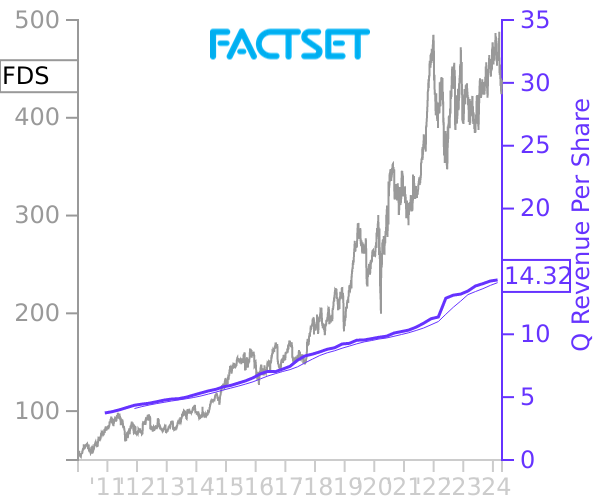
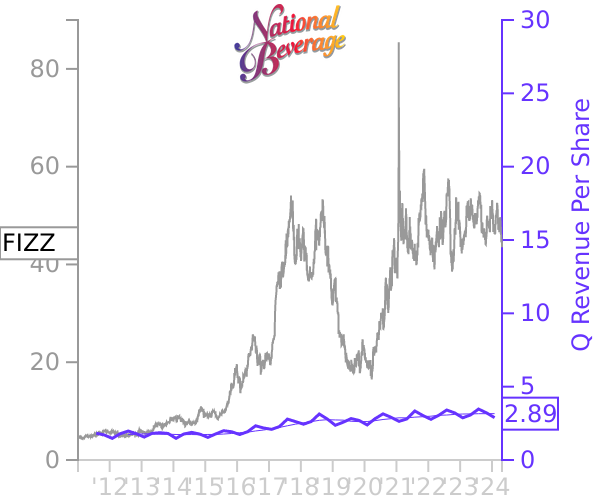
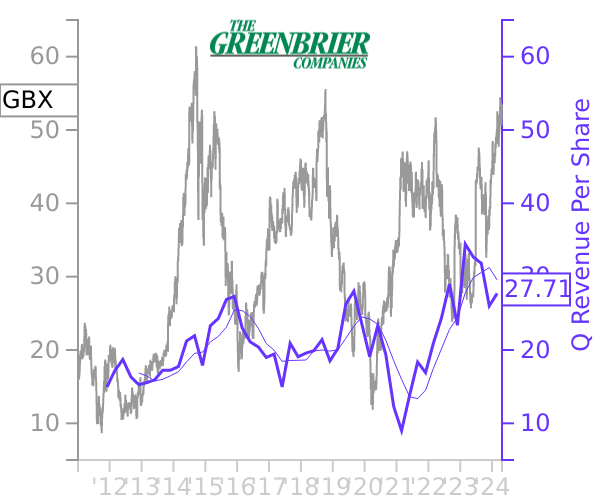
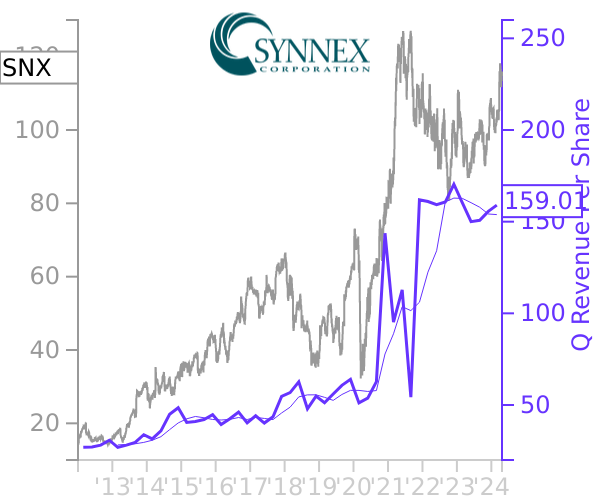
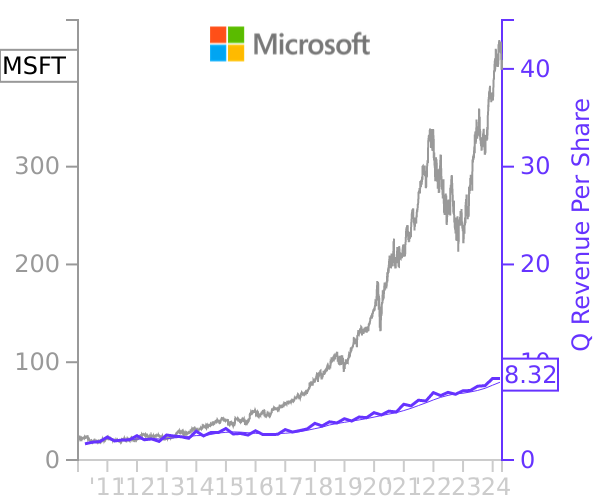
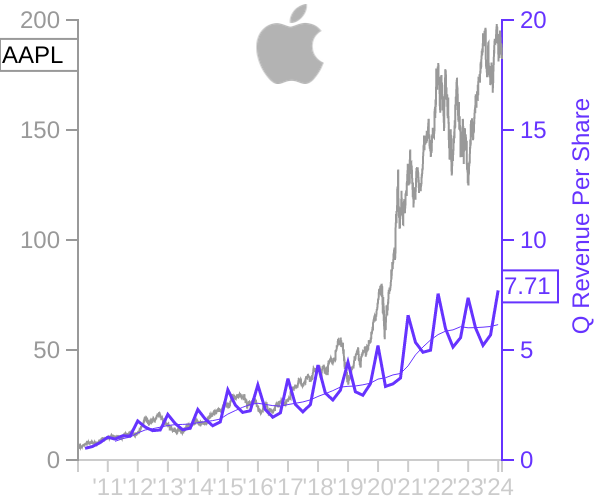
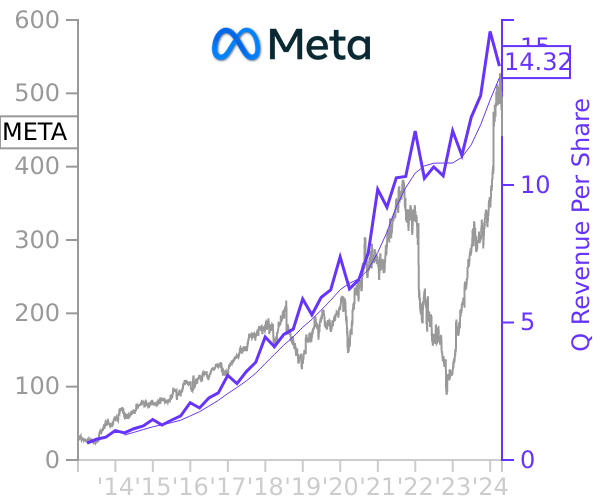
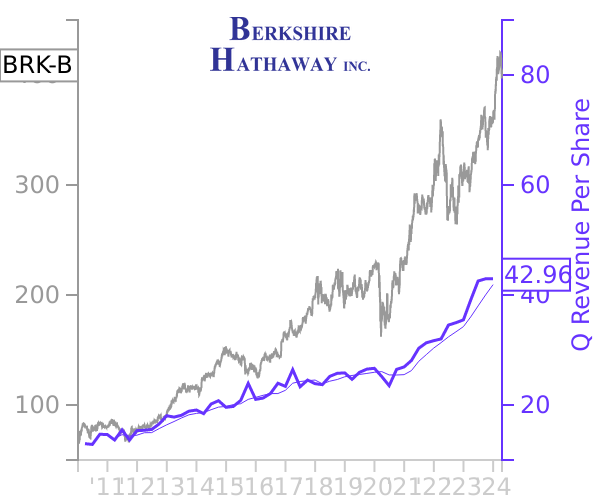
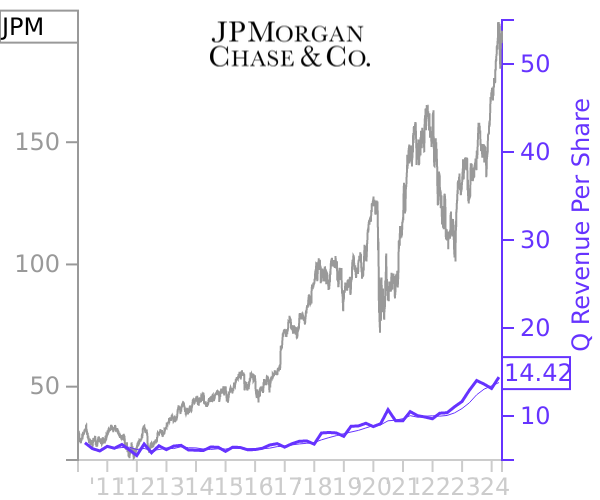
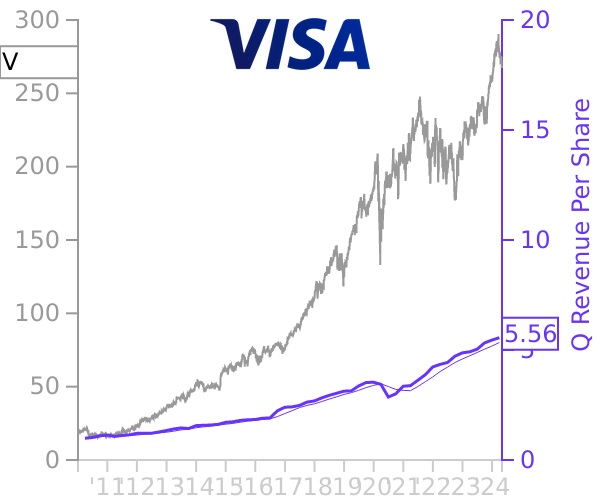
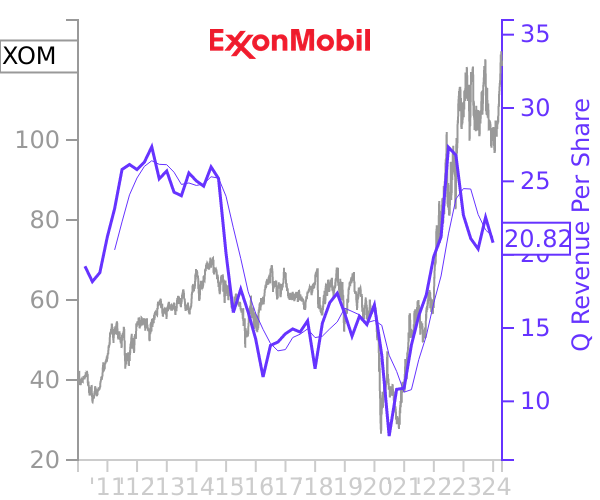
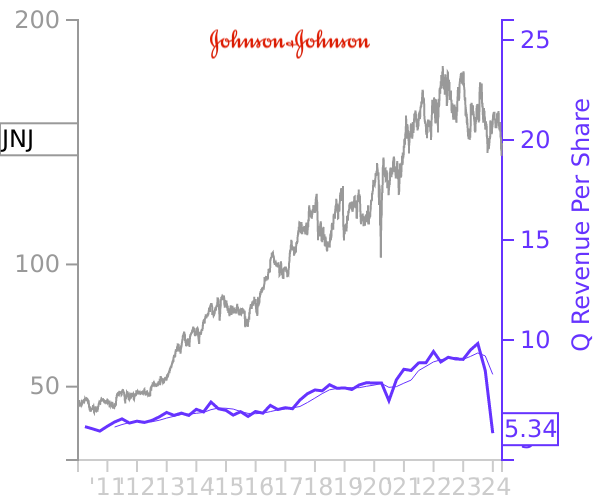
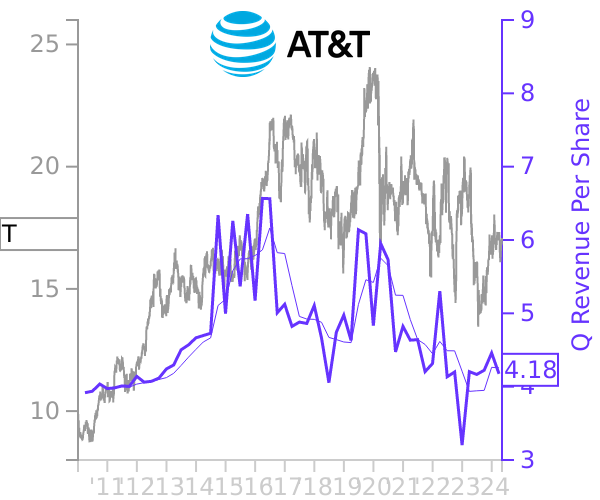
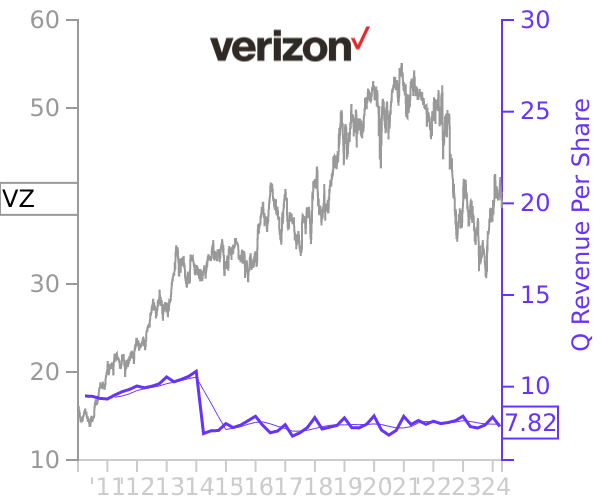
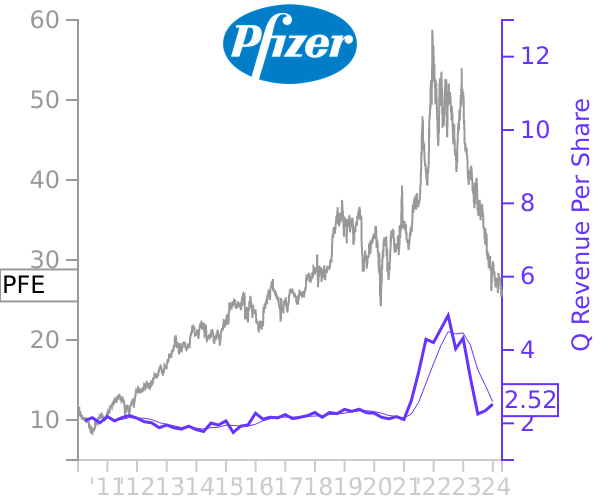
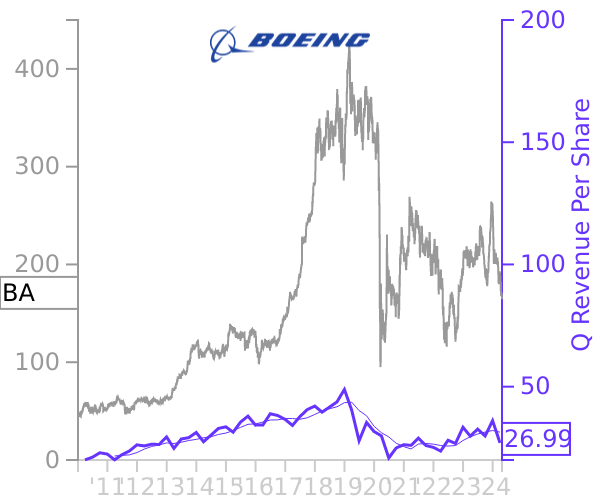
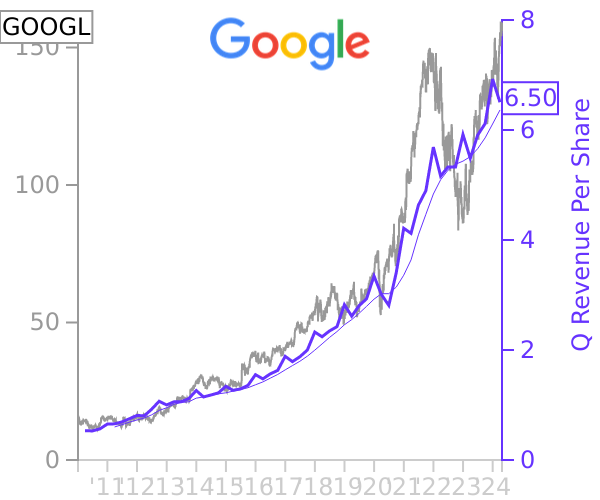
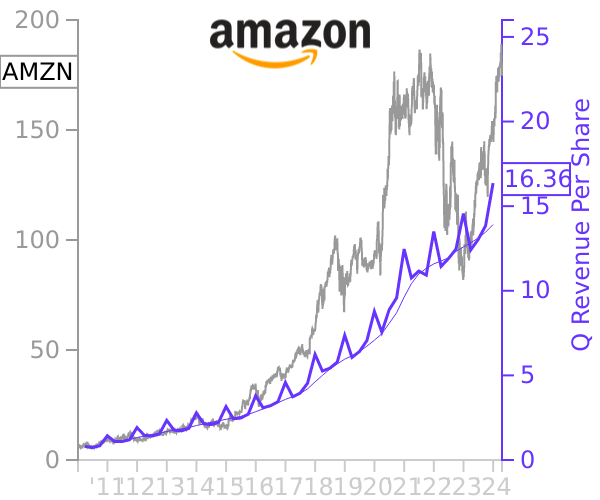
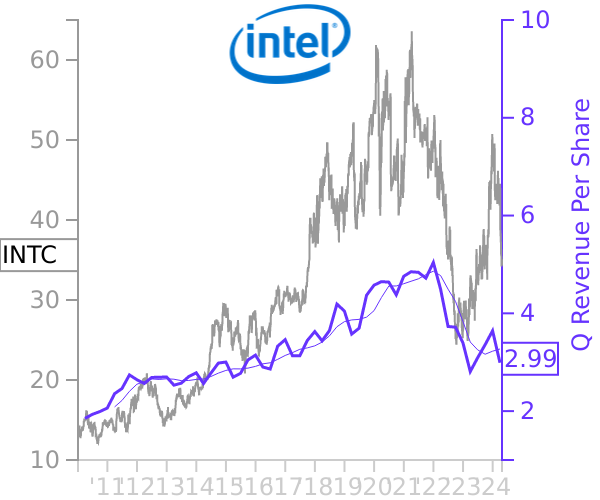
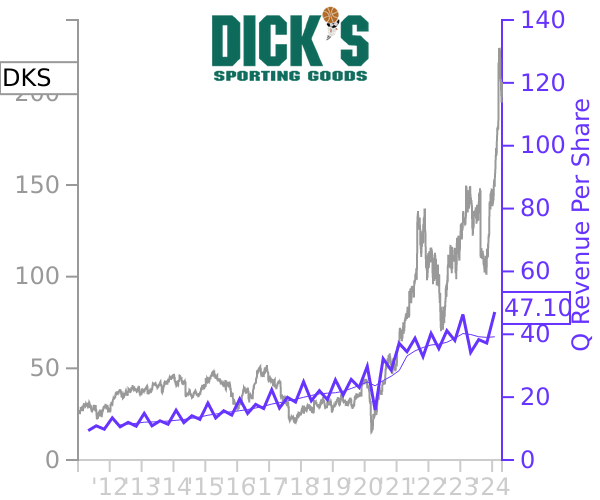
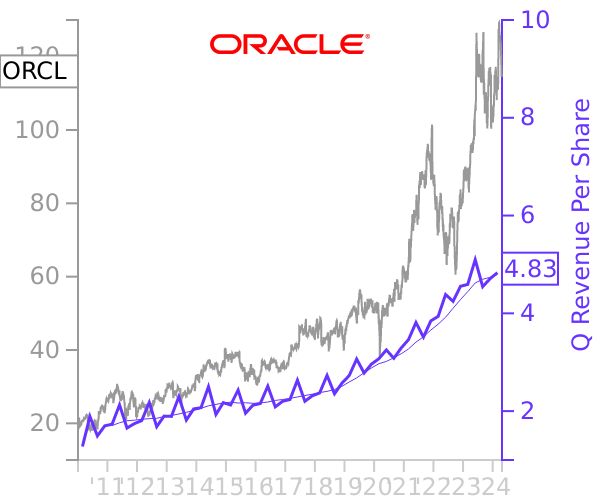
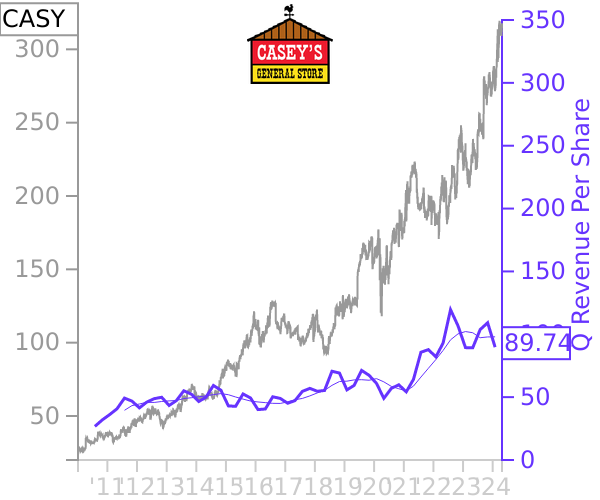
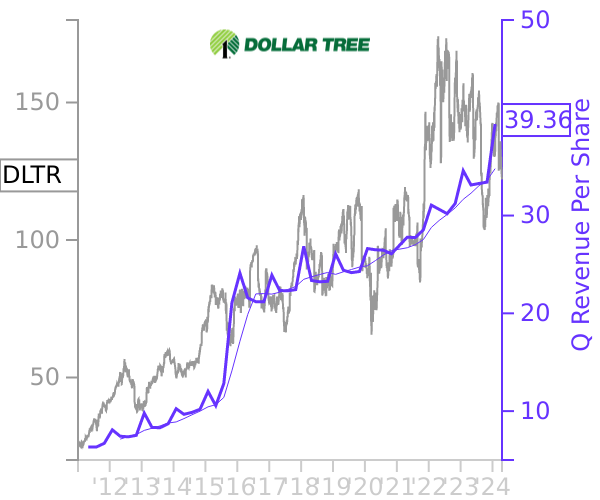
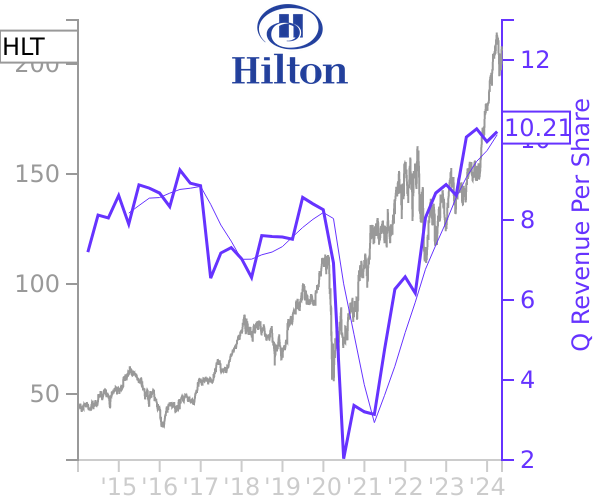
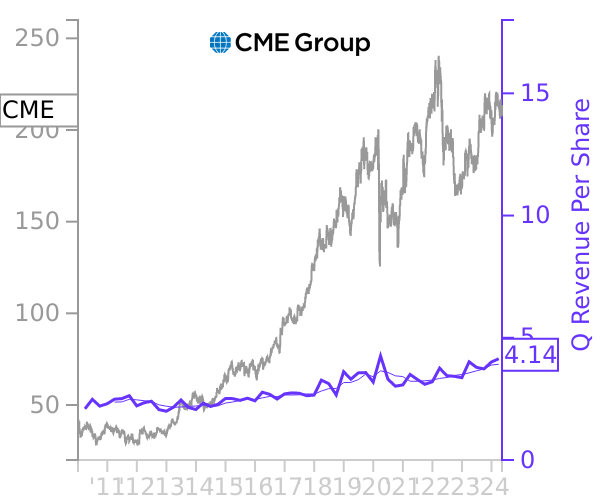
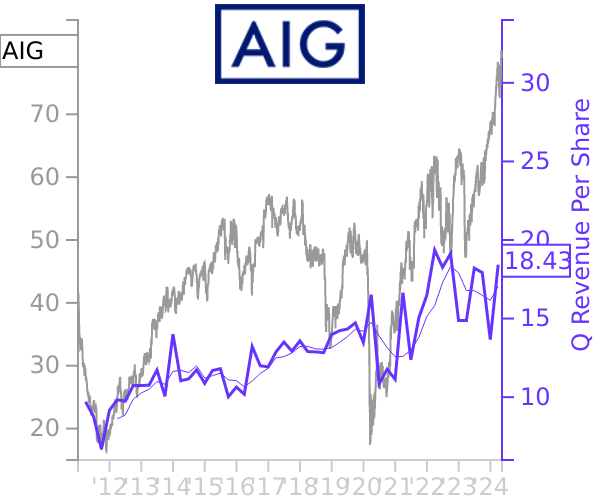
Quarterly revenue and earnings fluctuate like stock prices. Get the big picture with insights from company insiders and leading investors.
Recent Filings
Companies With Insider Buying
13F Ownership Filings
Altimeter Capital Management
Brad Gerstner
Appaloosa
David Tepper
Atreides Management
Gavin Baker
Baupost Group
Seth Klarman
Berkshire Hathaway
Warren Buffett
Bridgewater Associates
Ray Dalio
Duquesne Family Office
Stanley Druckenmiller
Glynn Capital Management
John W. Glynn
GMO Grantham, Mayo, Van Otterloo
Jeremy Grantham
Great Point Partners
Dr. Jeffrey Jay, M.D. and Mr. David Kroin
Greenlight Capital
David Einhorn
Hitchwood Capital Management
James Warby Crichton
Land & Buildings
Jonathan Litt
Night Owl Capital Management
John Kim and Eileen Ohnell
Oaktree Capital Management
Howard Marks
Pershing Square Capital Management
Bill Ackman
RGM Capital
Robert Moses
Riverbridge Partners
CIO Mark A. Thompson, and Portfolio Manager Rick D. Moulton
S Squared Technology
Kenneth Goldblatt
Sabby Management
Hal David Mintz
Scion Asset Management
Dr. Michael Burry
Third Point
Dan Loeb
Tiger Global Management
Chase Coleman, Feroz Dewan
Tudor Investment
Paul Tudor Jones
ValueAct Holdings
Jeff Ubben