Materials › Steel Works, Blast Furnaces And Rolling And Finishing Mills

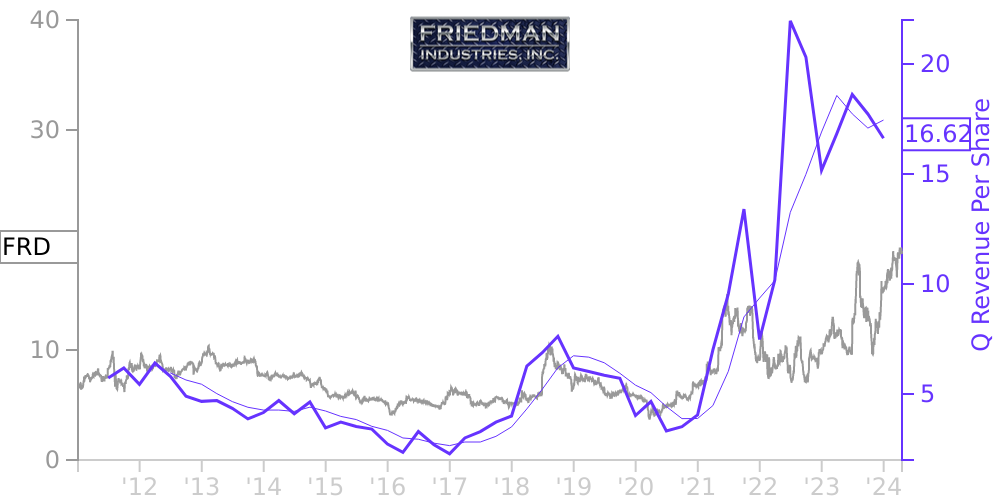
FRD Stock Price Correlated With Friedman Industries Financials
External Links ⌄
Income Statement
Cash Flow
Balance Sheet
FRD Income Statement
Enable JavaScript and reload
Revenue, Net:
Cost of Goods & Services Sold:
Gross Profit:
Selling, General & Admin Expense:
Research & Development Expense:
Total Operating Expenses:
Operating Income:
Income Taxes:
Net Income:
FRD Cash Flow
Enable JavaScript and reload
Operating Activities Net Income:
Depreciation, Depletion & Amortization:
Change in Accounts Receiveable:
Net Cash from Operations:
Repurchases/Buybacks Common Stock:
Issuance of Long-term Debt:
Cash Dividends Paid:
Net Cash from Financing Activities:
Property, Plant & Equipment Purchases:
Purchases of Businesses, Net of Cash:
Net Cash from Investing Activities:
Net Change in Cash & Equivalents:
FRD Balance Sheet
Enable JavaScript and reload
Cash and Cash Equivalents:
Short-Term Investments:
Accounts Receivable, Net:
Inventories:
Total Current Assets:
Property, Plant & Equipment, Net:
Total Assets:
Accounts Payable:
Current Portion of Long-Term Debt:
Total Short-Term Liabilities:
Long Term Debt, Non-Current Portion:
Total Long-Term Liabilities:
Total Liabilities:
COMPANY PROFILE
NOTE A — BASIS OF PRESENTATION
The accompanying unaudited, condensed consolidated financial statements have been prepared in accordance with the instructions to Form 10 -Q and do not include all of the information and footnotes required by U.S. generally accepted accounting principles for complete financial statements. In the opinion of management, all adjustments (consisting of normal recurring accruals) considered necessary for a fair presentation have been included. For further information, refer to the consolidated financial statements and footnotes of Friedman Industries, Incorporated (the “Company”) included in its annual report on Form 10 -K for the year ended March 31, 2022.
Business Combinations
The results of a business acquired in a business combination are included in the Company’s financial statements from the date of acquisition. The Company allocates the purchase price to the identifiable assets and liabilities of the acquired business at their acquisition date fair values. The excess of the purchase price over the amount allocated to the identifiable assets and liabilities, if any, is recorded as goodwill. Determining the fair value of assets acquired and liabilities assumed requires management to make significant judgments and estimates, including the selection of valuation methodologies, estimates of future revenue and cash flows, discount rates and selection of comparable companies. Acquisition-related transaction costs are expensed in the period in which the costs are incurred. Please refer to Note B for additional discussion of the acquisition completed by the Company during the quarter ended June 30, 2022.
Free historical financial statements for Friedman Industries Inc. See how revenue, income, cash flow, and balance sheet financials have changed over 51 quarters since 2011. Compare with FRD stock chart to see long term trends.
Data imported from Friedman Industries Inc SEC filings. Check original filings before making any investment decision.