Health Care › Biological Products, (No Diagnostic Substances)

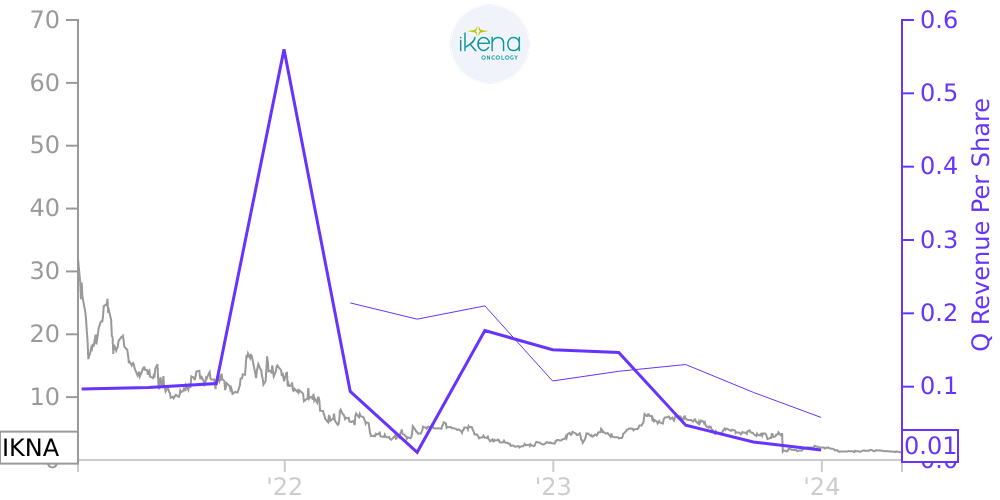
IKNA Stock Price Correlated With Ikena Oncology Financials
External Links ⌄
Income Statement
Cash Flow
Balance Sheet
IKNA Income Statement
Enable JavaScript and reload
Revenue, Net:
Cost of Goods & Services Sold:
Gross Profit:
Selling, General & Admin Expense:
Research & Development Expense:
Total Operating Expenses:
Operating Income:
Income Taxes:
Net Income:
IKNA Cash Flow
Enable JavaScript and reload
Operating Activities Net Income:
Depreciation, Depletion & Amortization:
Change in Accounts Receiveable:
Net Cash from Operations:
Repurchases/Buybacks Common Stock:
Issuance of Long-term Debt:
Cash Dividends Paid:
Net Cash from Financing Activities:
Property, Plant & Equipment Purchases:
Purchases of Businesses, Net of Cash:
Net Cash from Investing Activities:
Net Change in Cash & Equivalents:
IKNA Balance Sheet
Enable JavaScript and reload
Cash and Cash Equivalents:
Short-Term Investments:
Accounts Receivable, Net:
Inventories:
Total Current Assets:
Property, Plant & Equipment, Net:
Total Assets:
Accounts Payable:
Current Portion of Long-Term Debt:
Total Short-Term Liabilities:
Long Term Debt, Non-Current Portion:
Total Long-Term Liabilities:
Total Liabilities:
COMPANY PROFILE
Note 1. Organization and Basis of Presentation Ikena Oncology, Inc. (the "Company") is a targeted oncology company developing precision medicines tailored to biomarker-defined patient groups with specific unmet needs. With its robust biomarker and translational approach the Company aims to develop targeted treatments and define patient populations who are most likely to respond to treatment. The Company's current programs are across the Hippo pathway, RAS pathway, and key immune signals in the tumor-microenvironment (TME), with approaches to targeting both cancer driving targets and mechanisms of resistance to targeted therapies. The Company's focus on patient-driven development is platform and process agnostic, allowing it to research both known and novel targets, with a shared guiding principle of aiming to address the unmet needs of biomarker-defined patient populations. Since the Company commenced operations in 2016, it has advanced multiple product candidates into clinical development. In addition, the Company has a robust pipeline of discovery-stage targeted oncology programs. Basis of Presentation: The Company’s condensed consolidated financial statements have been prepared in conformity with accounting principles generally accepted in the United States of America (“U.S. GAAP”). Any reference in these notes to applicable guidance is meant to refer to the authoritative U.S. GAAP as found in the ASC and Accounting Standards Update (“ASU”) of the Financial Accounting Standards Board (“FASB”). The accompanying condensed consolidated financial statements and footnotes to the financial statements have been prepared on the same basis as the most recently audited annual financial statements and, in the opinion of management, reflect all normal recurring adjustments necessary for the fair presentation of the Company’s financial position as of March 31, 2022 and the results of its operations and its cash flows for the three months ended March 31, 2022. The results for the three months ended March 31, 2022 are not necessarily indicative of results to be expected for the year ending December 31, 2022, any other interim periods, or any future year or period. These condensed consolidated financial statements should be read in conjunction with, our audited consolidated financial statements for the year ended December 31, 2021, which were included in our Annual Report on Form 10-K that was filed with the Securities and Exchange Commission ("SEC") on March 17, 2022.
Free historical financial statements for Ikena Oncology Inc.. See how revenue, income, cash flow, and balance sheet financials have changed over 13 quarters since 2021. Compare with IKNA stock chart to see long term trends.
Data imported from Ikena Oncology Inc. SEC filings. Check original filings before making any investment decision.