Consumer Discretionary › Hotels And Motels

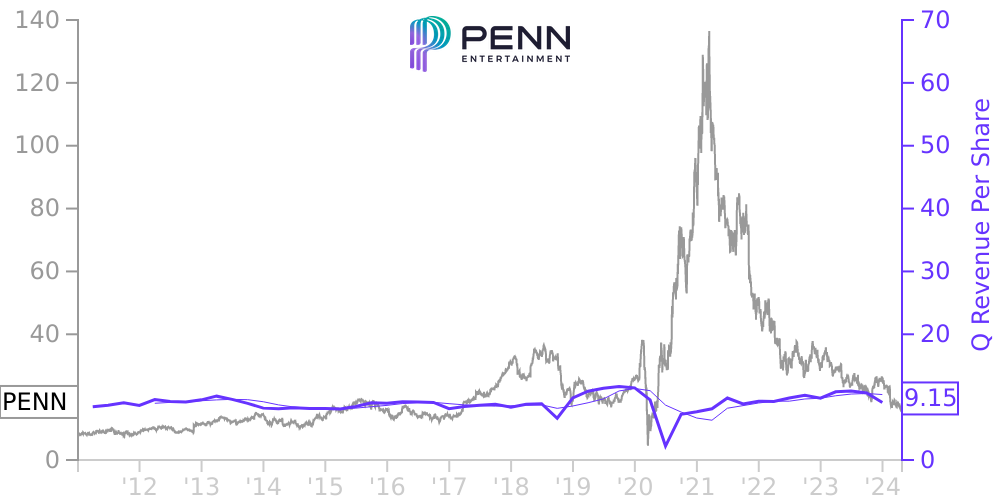
PENN Stock Price Correlated With Penn National Gaming Financials
External Links ⌄
Income Statement
Cash Flow
Balance Sheet
PENN Income Statement
Enable JavaScript and reload
Revenue, Net:
Cost of Goods & Services Sold:
Gross Profit:
Selling, General & Admin Expense:
Research & Development Expense:
Total Operating Expenses:
Operating Income:
Income Taxes:
Net Income:
PENN Cash Flow
Enable JavaScript and reload
Operating Activities Net Income:
Depreciation, Depletion & Amortization:
Change in Accounts Receiveable:
Net Cash from Operations:
Repurchases/Buybacks Common Stock:
Issuance of Long-term Debt:
Cash Dividends Paid:
Net Cash from Financing Activities:
Property, Plant & Equipment Purchases:
Purchases of Businesses, Net of Cash:
Net Cash from Investing Activities:
Net Change in Cash & Equivalents:
PENN Balance Sheet
Enable JavaScript and reload
Cash and Cash Equivalents:
Short-Term Investments:
Accounts Receivable, Net:
Inventories:
Total Current Assets:
Property, Plant & Equipment, Net:
Total Assets:
Accounts Payable:
Current Portion of Long-Term Debt:
Total Short-Term Liabilities:
Long Term Debt, Non-Current Portion:
Total Long-Term Liabilities:
Total Liabilities:
COMPANY PROFILE
2. Principles of Consolidation
The consolidated financial statements include the accounts of Penn and its subsidiaries, including wholly-owned subsidiaries and subsidiaries that had a noncontrolling interest. Investment in and advances to unconsolidated affiliates are accounted for under the equity method. All significant intercompany accounts and transactions have been eliminated in consolidation.
The consolidated financial statements include the accounts of Penn and its subsidiaries, including wholly-owned subsidiaries and subsidiaries that had a noncontrolling interest. Investment in and advances to unconsolidated affiliates are accounted for under the equity method. All significant intercompany accounts and transactions have been eliminated in consolidation.
Free historical financial statements for Penn National Gaming Inc. See how revenue, income, cash flow, and balance sheet financials have changed over 53 quarters since 2011. Compare with PENN stock chart to see long term trends.
Data imported from Penn National Gaming Inc SEC filings. Check original filings before making any investment decision.