Health Care › Services-Business Services, Nec

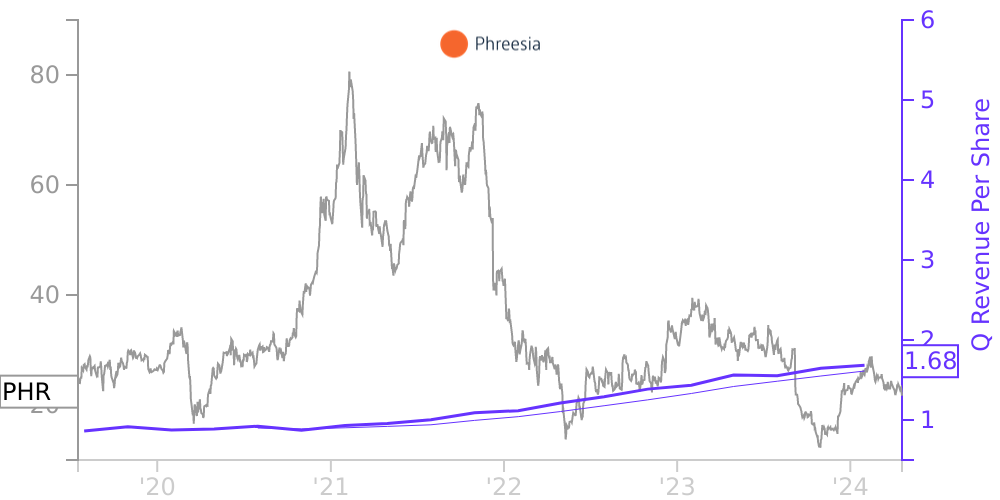
PHR Stock Price Correlated With Phreesia Financials
External Links ⌄
Income Statement
Cash Flow
Balance Sheet
PHR Income Statement
Enable JavaScript and reload
Revenue, Net:
Cost of Goods & Services Sold:
Gross Profit:
Selling, General & Admin Expense:
Research & Development Expense:
Total Operating Expenses:
Operating Income:
Income Taxes:
Net Income:
PHR Cash Flow
Enable JavaScript and reload
Operating Activities Net Income:
Depreciation, Depletion & Amortization:
Change in Accounts Receiveable:
Net Cash from Operations:
Repurchases/Buybacks Common Stock:
Issuance of Long-term Debt:
Cash Dividends Paid:
Net Cash from Financing Activities:
Property, Plant & Equipment Purchases:
Purchases of Businesses, Net of Cash:
Net Cash from Investing Activities:
Net Change in Cash & Equivalents:
PHR Balance Sheet
Enable JavaScript and reload
Cash and Cash Equivalents:
Short-Term Investments:
Accounts Receivable, Net:
Inventories:
Total Current Assets:
Property, Plant & Equipment, Net:
Total Assets:
Accounts Payable:
Current Portion of Long-Term Debt:
Total Short-Term Liabilities:
Long Term Debt, Non-Current Portion:
Total Long-Term Liabilities:
Total Liabilities:
COMPANY PROFILE
Background and liquidity (a) Background
Phreesia, Inc. (the "Company") is a leading provider of comprehensive software solutions that improve the operational and financial performance of healthcare organizations by activating patients in their care to optimize patient health outcomes. Through the SaaS-based technology platform (the "Phreesia Platform" or "Platform"), the Company offers healthcare services clients a robust suite of integrated solutions that manage patient access, registration, payments and clinical support. The Company’s Platform also provides life sciences companies, patient advocacy, public interest and other not-for-profit organizations with a channel for targeted and direct communication with patients. In connection with the patient intake and registration process, Phreesia offers its healthcare services clients the ability to lease tablets ("PhreesiaPads") and on-site kiosks ("Arrivals Kiosks") along with their monthly subscription. The Company was formed in May 2005, and has several offices in the U.S. and Canada. The Company completed an initial public offering ("IPO") in July 2019.
During fiscal 2021, the Company changed its headquarters from New York, New York to Raleigh, North Carolina.
b) Liquidity
Since the Company commenced operations, it has not generated sufficient revenue to meet its operating expenses and has continued to incur significant net losses. To date, the Company has primarily relied upon the proceeds from issuances of common stock, debt and preferred stock to fund its operations as well as sales of Company products and services in the normal course of business. Management believes that net losses and negative cash flows will continue for at least the next year.
Management believes that the Company’s cash and cash equivalents at January 31, 2022, along with cash generated in the normal course of business, and available borrowing capacity under its Second Amended and Restated Loan and Security Agreement (the "Second SVB Facility") with Silicon Valley Bank ("SVB") (Note 6), are sufficient to fund its operations for at least the next 12 months.
On March 28, 2022, the Company entered into the First Loan Modification Agreement to the Second SVB Facility (as amended, the "Third SVB Facility"), to increase the available borrowing capacity to $100.0 million from $50.0 million.
The Company will seek to obtain additional financing, if needed, to successfully implement its long-term strategy.
Free historical financial statements for Phreesia Inc. See how revenue, income, cash flow, and balance sheet financials have changed over 19 quarters since 2019. Compare with PHR stock chart to see long term trends.
Data imported from Phreesia Inc SEC filings. Check original filings before making any investment decision.