
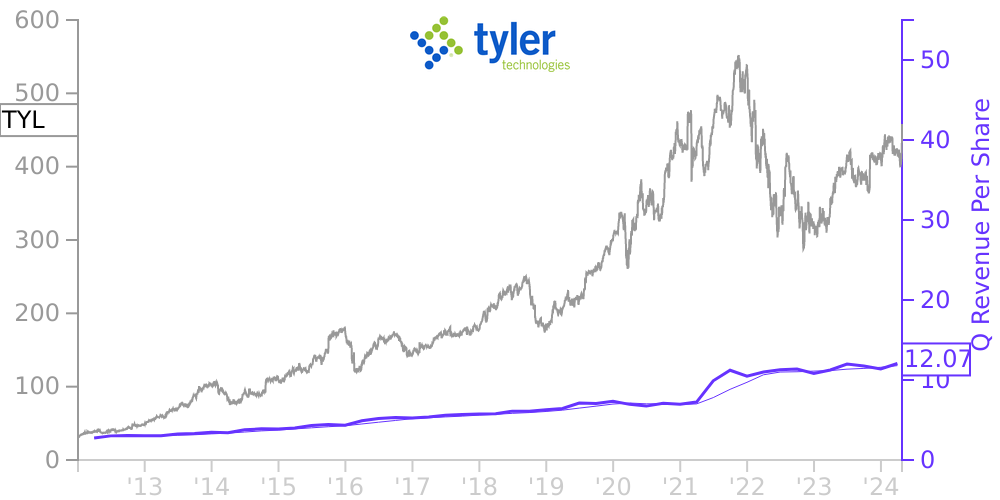
TYL Stock Price Correlated With Tyler Technologies Financials
External Links ⌄
Income Statement
Cash Flow
Balance Sheet
TYL Income Statement
Enable JavaScript and reload
Revenue, Net:
Cost of Goods & Services Sold:
Gross Profit:
Selling, General & Admin Expense:
Research & Development Expense:
Total Operating Expenses:
Operating Income:
Income Taxes:
Net Income:
TYL Cash Flow
Enable JavaScript and reload
Operating Activities Net Income:
Depreciation, Depletion & Amortization:
Change in Accounts Receiveable:
Net Cash from Operations:
Repurchases/Buybacks Common Stock:
Issuance of Long-term Debt:
Cash Dividends Paid:
Net Cash from Financing Activities:
Property, Plant & Equipment Purchases:
Purchases of Businesses, Net of Cash:
Net Cash from Investing Activities:
Net Change in Cash & Equivalents:
TYL Balance Sheet
Enable JavaScript and reload
Cash and Cash Equivalents:
Short-Term Investments:
Accounts Receivable, Net:
Inventories:
Total Current Assets:
Property, Plant & Equipment, Net:
Total Assets:
Accounts Payable:
Current Portion of Long-Term Debt:
Total Short-Term Liabilities:
Long Term Debt, Non-Current Portion:
Total Long-Term Liabilities:
Total Liabilities:
COMPANY PROFILE
Basis of Presentation We prepared the accompanying condensed consolidated financial statements following the requirements of the Securities and Exchange Commission (“SEC”) and accounting principles generally accepted in the United States, or GAAP, for interim reporting. As permitted under those rules, certain footnotes or other financial information that are normally required by GAAP can be condensed or omitted for interim periods. Balance sheet amounts are as of June 30, 2022, and December 31, 2021, and operating result amounts are for the three and six months ended June 30, 2022, and 2021, respectively, and include all normal and recurring adjustments that we considered necessary for the fair summarized presentation of our financial position and operating results. As these are condensed financial statements, one should also read the financial statements and notes included in our latest Form 10-K for the year ended December 31, 2021. Revenues, expenses, assets, and liabilities can vary during each quarter of the year. Therefore, the results and trends in these interim financial statements may not be the same as those for the full year. Certain amounts for the previous year have been reclassified to conform to the current year presentation.
Comprehensive income (loss) is defined as the change in equity of a business enterprise during a period from transactions and other events and circumstances from non-owner sources and includes all components of net income (loss) and other comprehensive income (loss). During the three and six months ended June 30, 2022, we had approximately $66,000 and $763,000 of other comprehensive loss, net of taxes, from our available-for-sale investment holdings and no items of other comprehensive income (loss) during the three and six months ended June 30, 2021.
Comprehensive income (loss) is defined as the change in equity of a business enterprise during a period from transactions and other events and circumstances from non-owner sources and includes all components of net income (loss) and other comprehensive income (loss). During the three and six months ended June 30, 2022, we had approximately $66,000 and $763,000 of other comprehensive loss, net of taxes, from our available-for-sale investment holdings and no items of other comprehensive income (loss) during the three and six months ended June 30, 2021.
Free historical financial statements for Tyler Technologies Inc. See how revenue, income, cash flow, and balance sheet financials have changed over 49 quarters since 2012. Compare with TYL stock chart to see long term trends.
Data imported from Tyler Technologies Inc SEC filings. Check original filings before making any investment decision.