Financials › Fire, Marine And Casualty Insurance

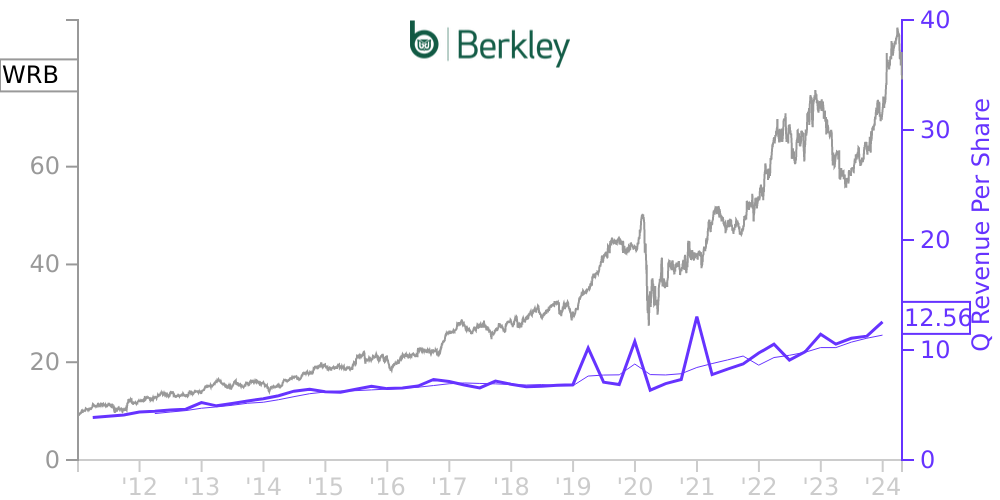
WRB Stock Price Correlated With W R Berkley Financials
External Links ⌄
Income Statement
Cash Flow
Balance Sheet
WRB Income Statement
Enable JavaScript and reload
Revenue, Net:
Cost of Goods & Services Sold:
Gross Profit:
Selling, General & Admin Expense:
Research & Development Expense:
Total Operating Expenses:
Operating Income:
Income Taxes:
Net Income:
WRB Cash Flow
Enable JavaScript and reload
Operating Activities Net Income:
Depreciation, Depletion & Amortization:
Change in Accounts Receiveable:
Net Cash from Operations:
Repurchases/Buybacks Common Stock:
Issuance of Long-term Debt:
Cash Dividends Paid:
Net Cash from Financing Activities:
Property, Plant & Equipment Purchases:
Purchases of Businesses, Net of Cash:
Net Cash from Investing Activities:
Net Change in Cash & Equivalents:
WRB Balance Sheet
Enable JavaScript and reload
Cash and Cash Equivalents:
Short-Term Investments:
Accounts Receivable, Net:
Inventories:
Total Current Assets:
Property, Plant & Equipment, Net:
Total Assets:
Accounts Payable:
Current Portion of Long-Term Debt:
Total Short-Term Liabilities:
Long Term Debt, Non-Current Portion:
Total Long-Term Liabilities:
Total Liabilities:
COMPANY PROFILE
General The unaudited consolidated financial statements, which include the accounts of W. R. Berkley Corporation and its subsidiaries (the “Company”), have been prepared on the basis of U.S. generally accepted accounting principles (“GAAP”) for interim financial information. Accordingly, they do not include all the information and notes required by GAAP for annual financial statements. The unaudited consolidated financial statements reflect all adjustments, consisting only of normal recurring items, which are necessary to present fairly the Company’s financial position and results of operations on a basis consistent with the prior audited consolidated financial statements. Operating results for interim periods are not necessarily indicative of the results that may be expected for the year. All significant intercompany accounts and transactions have been eliminated. The preparation of financial statements in conformity with GAAP requires management to make estimates and assumptions that affect the reported amounts of assets and liabilities and disclosures of contingent assets and liabilities at the date of the financial statements and the revenues and expenses reflected during the reporting period. For further information related to areas of judgment and estimates and other information necessary to understand the Company’s financial position and results of operations, refer to the audited consolidated financial statements and notes included in the Company’s Annual Report on Form 10-K for the year ended December 31, 2021.
Reclassifications have been made in the 2021 financial statements as originally reported to conform to the presentation of the 2022 financial statements. Shares outstanding and per share amounts have been adjusted to reflect the 3-for-2 common stock split effected on March 23, 2022.
The income tax provision has been computed based on the Company’s estimated annual effective tax rate. The effective income tax rate differs from the federal income tax rate of 21% primarily due to a net reduction to the Company’s valuation allowance against foreign tax credits and foreign net operating losses, which was partially offset by state income taxes.
Free historical financial statements for W R Berkley Corp.. See how revenue, income, cash flow, and balance sheet financials have changed over 53 quarters since 2011. Compare with WRB stock chart to see long term trends.
Data imported from W R Berkley Corp. SEC filings. Check original filings before making any investment decision.