Health Care › Laboratory Analytical Instruments

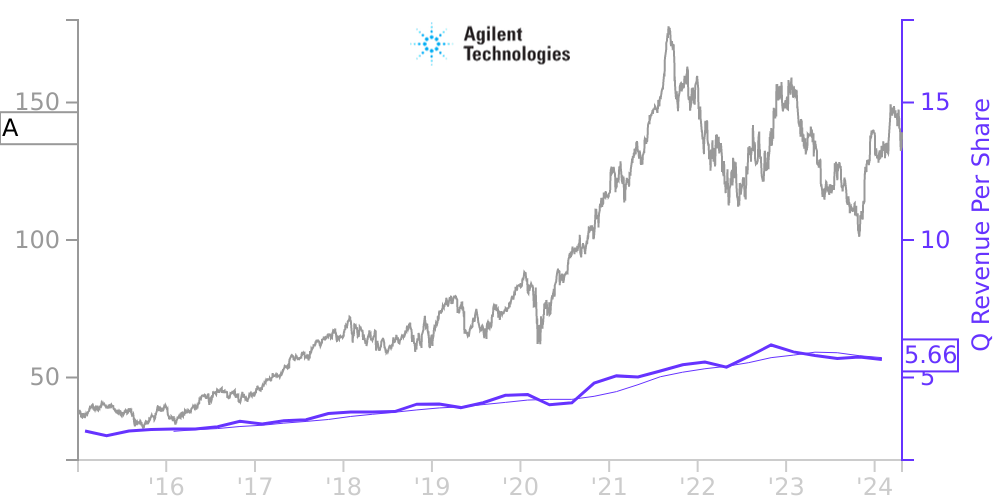
A Stock Price Correlated With Agilent Technologies Financials
External Links ⌄
Income Statement
Cash Flow
Balance Sheet
A Income Statement
Enable JavaScript and reload
Revenue, Net:
Cost of Goods & Services Sold:
Gross Profit:
Selling, General & Admin Expense:
Research & Development Expense:
Total Operating Expenses:
Operating Income:
Income Taxes:
Net Income:
A Cash Flow
Enable JavaScript and reload
Operating Activities Net Income:
Depreciation, Depletion & Amortization:
Change in Accounts Receiveable:
Net Cash from Operations:
Repurchases/Buybacks Common Stock:
Issuance of Long-term Debt:
Cash Dividends Paid:
Net Cash from Financing Activities:
Property, Plant & Equipment Purchases:
Purchases of Businesses, Net of Cash:
Net Cash from Investing Activities:
Net Change in Cash & Equivalents:
A Balance Sheet
Enable JavaScript and reload
Cash and Cash Equivalents:
Short-Term Investments:
Accounts Receivable, Net:
Inventories:
Total Current Assets:
Property, Plant & Equipment, Net:
Total Assets:
Accounts Payable:
Current Portion of Long-Term Debt:
Total Short-Term Liabilities:
Long Term Debt, Non-Current Portion:
Total Long-Term Liabilities:
Total Liabilities:
COMPANY PROFILE
OVERVIEW, BASIS OF PRESENTATION AND SUMMARY OF SIGNIFICANT ACCOUNTING POLICIES
Overview. Agilent Technologies, Inc. ("we," "Agilent" or the "company"), incorporated in Delaware in May 1999, is a global leader in life sciences, diagnostics and applied chemical markets, providing application focused solutions that include instruments, software, services and consumables for the entire laboratory workflow.
Our fiscal year-end is October 31, and our fiscal quarters end on January 31, April 30 and July 31. Unless otherwise stated, these dates refer to our fiscal year and fiscal quarters.
New Segment Structure. In the first quarter of fiscal year 2022, we announced a change in organizational structure designed to enable our growth strategies and strengthen our focus on customers. Our chemistries and supplies business and our remarketed instruments business moved from our Agilent CrossLab business segment to our life sciences and applied markets business segment. Service revenue and cost of sales related to the previous acquisition of BioTek moved from our life sciences and applied markets business segment to our Agilent CrossLab business segment. Following this reorganization, we continue to have three business segments (life sciences and applied markets, diagnostics and genomics and Agilent CrossLab), each of which continues to comprise a reportable segment. We began reporting under this new structure with the Quarterly Report on Form 10-Q for the period ended January 31, 2022. Historical financial segment information has been recast to conform to this new presentation in our financial statements and accompanying notes. There was no change to our diagnostics and genomics business segment.
Basis of Presentation . We have prepared the accompanying financial data for the three and six months ended April 30, 2022 and 2021 pursuant to the rules and regulations of the U.S. Securities and Exchange Commission (“SEC”). Certain information and footnote disclosures normally included in financial statements prepared in accordance with generally accepted accounting principles (“GAAP”) in the U.S. have been condensed or omitted pursuant to such rules and regulations. The October 31, 2021 condensed balance sheet data was derived from audited financial statements but does not include all the disclosures required in audited financial statements by U.S. GAAP. The accompanying financial data and information should be read in conjunction with our Annual Report on Form 10-K for the fiscal year ended October 31, 2021.
In the opinion of management, the accompanying condensed consolidated financial statements contain all normal and recurring adjustments necessary for a fair statement of our condensed consolidated balance sheet as of April 30, 2022 and October 31, 2021, condensed consolidated statement of comprehensive income (loss) for the three and six months ended April 30, 2022 and 2021, condensed consolidated statement of operations for the three and six months ended April 30, 2022 and 2021, condensed consolidated statement of cash flows for the six months ended April 30, 2022 and 2021 and condensed consolidated statement of equity for the three and six months ended April 30, 2022 and 2021.
Use of Estimates. The preparation of condensed consolidated financial statements in accordance with GAAP in the U.S. requires management to make estimates and assumptions that affect the amounts reported in our condensed consolidated financial statements and accompanying notes. Management bases its estimates on historical experience and various other assumptions believed to be reasonable. Although these estimates are based on management’s best knowledge of current events and actions that may impact the company in the future, actual results may be different from the estimates. Our critical accounting policies are those that affect our financial statements materially and involve difficult, subjective or complex judgments by management. Those policies are revenue
Free historical financial statements for Agilent Technologies Inc. See how revenue, income, cash flow, and balance sheet financials have changed over 46 quarters since 2015. Compare with A stock chart to see long term trends.
Data imported from Agilent Technologies Inc SEC filings. Check original filings before making any investment decision.