Health Care › Pharmaceutical Preparations

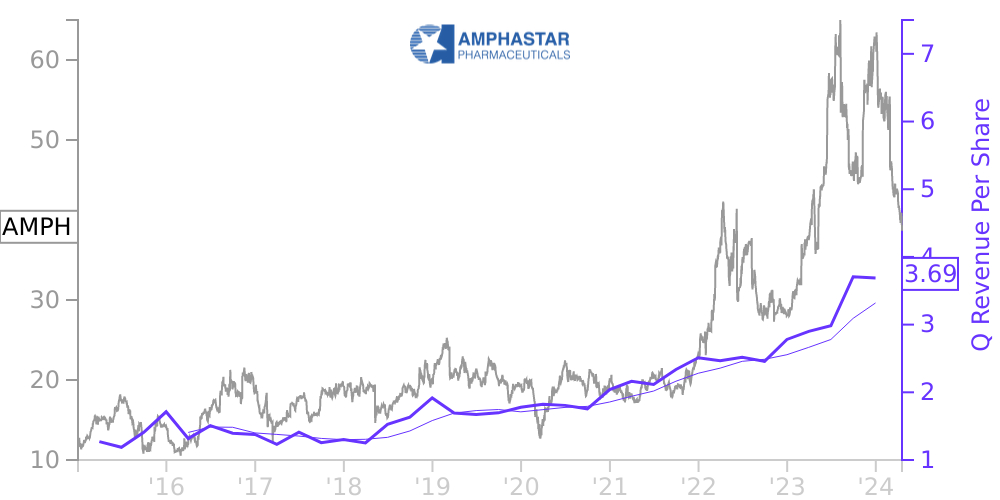
AMPH Stock Price Correlated With Amphastar Pharmaceuticals Financials
External Links ⌄
Income Statement
Cash Flow
Balance Sheet
AMPH Income Statement
Enable JavaScript and reload
Revenue, Net:
Cost of Goods & Services Sold:
Gross Profit:
Selling, General & Admin Expense:
Research & Development Expense:
Total Operating Expenses:
Operating Income:
Income Taxes:
Net Income:
AMPH Cash Flow
Enable JavaScript and reload
Operating Activities Net Income:
Depreciation, Depletion & Amortization:
Change in Accounts Receiveable:
Net Cash from Operations:
Repurchases/Buybacks Common Stock:
Issuance of Long-term Debt:
Cash Dividends Paid:
Net Cash from Financing Activities:
Property, Plant & Equipment Purchases:
Purchases of Businesses, Net of Cash:
Net Cash from Investing Activities:
Net Change in Cash & Equivalents:
AMPH Balance Sheet
Enable JavaScript and reload
Cash and Cash Equivalents:
Short-Term Investments:
Accounts Receivable, Net:
Inventories:
Total Current Assets:
Property, Plant & Equipment, Net:
Total Assets:
Accounts Payable:
Current Portion of Long-Term Debt:
Total Short-Term Liabilities:
Long Term Debt, Non-Current Portion:
Total Long-Term Liabilities:
Total Liabilities:
COMPANY PROFILE
Note 1. Genera l Amphastar Pharmaceuticals, Inc., a Delaware corporation (together with its subsidiaries, hereinafter referred to as the “Company”) is a bio-pharmaceutical company that develops, manufactures, markets, and sells generic and proprietary injectable, inhalation, and intranasal products, including products with high technical barriers to market entry. Additionally, the Company sells insulin active pharmaceutical ingredient, or API, products. Most of the Company’s products are used in hospital or urgent care clinical settings and are primarily contracted and distributed through group purchasing organizations and drug wholesalers. The Company’s insulin API products are sold to other pharmaceutical companies for use in their own products and are being used by the Company in the development of injectable finished pharmaceutical products. The Company’s inhalation product, Primatene Mist ®, is primarily distributed through drug retailers. The accompanying unaudited condensed consolidated financial statements should be read in conjunction with the audited consolidated financial statements of the Company for the year ended December 31, 2021 and the notes thereto as filed with the Securities and Exchange Commission, or SEC, in the Company’s Annual Report on Form 10-K for the year ended December 31, 2021. Certain information and footnote disclosures normally included in annual financial statements prepared in accordance with United States generally accepted accounting principles, or GAAP, have been condensed or omitted from the accompanying condensed consolidated financial statements. The accompanying year-end condensed consolidated balance sheet was derived from the audited financial statements. The accompanying interim financial statements are unaudited, but reflect all adjustments which are, in the opinion of management, necessary for a fair statement of the Company’s consolidated financial position, results of operations, comprehensive income (loss), stockholders’ equity, and cash flows for the periods presented. Unless otherwise noted, all such adjustments are of a normal, recurring nature. The Company’s results of operations, comprehensive income (loss) and cash flows for the interim periods are not necessarily indicative of the results of operations and cash flows that it may achieve in future periods.
Free historical financial statements for Amphastar Pharmaceuticals Inc. See how revenue, income, cash flow, and balance sheet financials have changed over 45 quarters since 2015. Compare with AMPH stock chart to see long term trends.
Data imported from Amphastar Pharmaceuticals Inc SEC filings. Check original filings before making any investment decision.