Health Care › Pharmaceutical Preparations

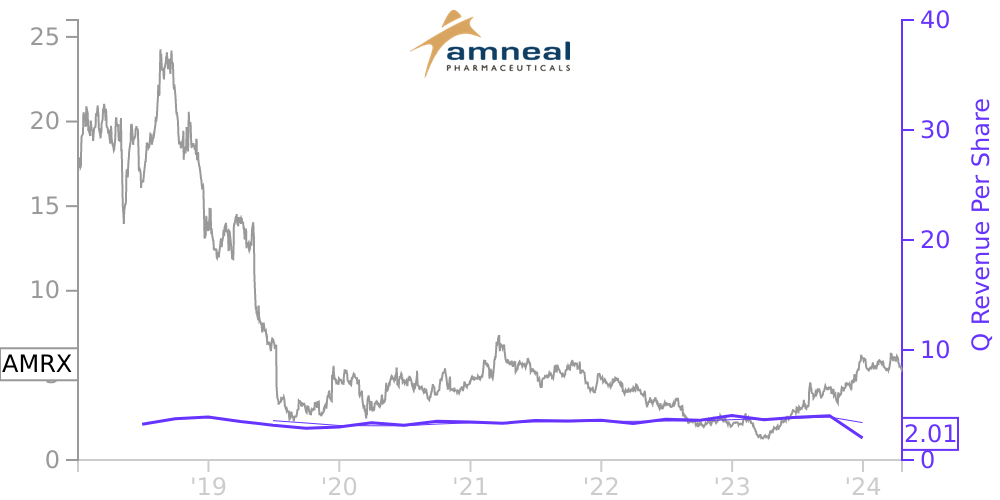
AMRX Stock Price Correlated With Amneal Pharmaceuticals Financials
External Links ⌄
Income Statement
Cash Flow
Balance Sheet
AMRX Income Statement
Enable JavaScript and reload
Revenue, Net:
Cost of Goods & Services Sold:
Gross Profit:
Selling, General & Admin Expense:
Research & Development Expense:
Total Operating Expenses:
Operating Income:
Income Taxes:
Net Income:
AMRX Cash Flow
Enable JavaScript and reload
Operating Activities Net Income:
Depreciation, Depletion & Amortization:
Change in Accounts Receiveable:
Net Cash from Operations:
Repurchases/Buybacks Common Stock:
Issuance of Long-term Debt:
Cash Dividends Paid:
Net Cash from Financing Activities:
Property, Plant & Equipment Purchases:
Purchases of Businesses, Net of Cash:
Net Cash from Investing Activities:
Net Change in Cash & Equivalents:
AMRX Balance Sheet
Enable JavaScript and reload
Cash and Cash Equivalents:
Short-Term Investments:
Accounts Receivable, Net:
Inventories:
Total Current Assets:
Property, Plant & Equipment, Net:
Total Assets:
Accounts Payable:
Current Portion of Long-Term Debt:
Total Short-Term Liabilities:
Long Term Debt, Non-Current Portion:
Total Long-Term Liabilities:
Total Liabilities:
COMPANY PROFILE
Nature of Operations Amneal Pharmaceuticals, Inc. (the “Company”) is a pharmaceutical company specializing in developing, manufacturing, marketing and distributing high-value generic and branded specialty pharmaceutical products across a broad array of dosage forms and therapeutic areas. The Company operates principally in the United States, India, and Ireland, and sells to wholesalers, distributors, hospitals, chain pharmacies and individual pharmacies, either directly or indirectly. The Company is a holding company, whose principal assets are common units (“Amneal Common Units”) of Amneal Pharmaceuticals, LLC (“Amneal”).
The group, together with their affiliates and certain assignees, who owned Amneal when it was a private company (the “Members” or the “Amneal Group”) held 50.4% of Amneal Common Units and the Company held the remaining 49.6% as of December 31, 2021.
In 2018, Amneal completed the acquisition of Impax Laboratories, Inc. (“Impax”), a generic and specialty pharmaceutical company.
Free historical financial statements for Amneal Pharmaceuticals Inc. See how revenue, income, cash flow, and balance sheet financials have changed over 32 quarters since 2018. Compare with AMRX stock chart to see long term trends.
Data imported from Amneal Pharmaceuticals Inc SEC filings. Check original filings before making any investment decision.