Communication › Telephone Communications (No Radio Telephone)

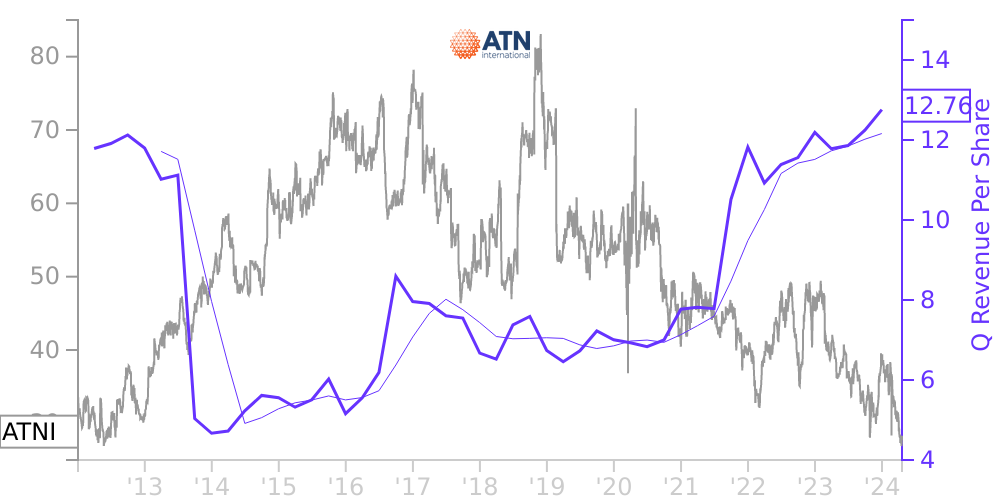
ATNI Stock Price Correlated With ATN International Financials
External Links ⌄
Income Statement
Cash Flow
Balance Sheet
ATNI Income Statement
Enable JavaScript and reload
Revenue, Net:
Cost of Goods & Services Sold:
Gross Profit:
Selling, General & Admin Expense:
Research & Development Expense:
Total Operating Expenses:
Operating Income:
Income Taxes:
Net Income:
ATNI Cash Flow
Enable JavaScript and reload
Operating Activities Net Income:
Depreciation, Depletion & Amortization:
Change in Accounts Receiveable:
Net Cash from Operations:
Repurchases/Buybacks Common Stock:
Issuance of Long-term Debt:
Cash Dividends Paid:
Net Cash from Financing Activities:
Property, Plant & Equipment Purchases:
Purchases of Businesses, Net of Cash:
Net Cash from Investing Activities:
Net Change in Cash & Equivalents:
ATNI Balance Sheet
Enable JavaScript and reload
Cash and Cash Equivalents:
Short-Term Investments:
Accounts Receivable, Net:
Inventories:
Total Current Assets:
Property, Plant & Equipment, Net:
Total Assets:
Accounts Payable:
Current Portion of Long-Term Debt:
Total Short-Term Liabilities:
Long Term Debt, Non-Current Portion:
Total Long-Term Liabilities:
Total Liabilities:
COMPANY PROFILE
2. SUMMARY OF SIGNIFICANT ACCOUNTING POLICIES Basis of Presentation The consolidated financial statements include the accounts of the Company, its majority-owned subsidiaries and certain entities, which are consolidated in accordance with the provisions of the Financial Accounting Standards Board’s (“FASB”) authoritative guidance on the consolidation of variable interest entities since it is determined that the Company is the primary beneficiary of these entities. Certain reclassifications have been made to the December 31, 2020 and 2019 financial statements to conform to the December 31, 2021 presentation. Such reclassifications include the disaggregation of revenue and costs of revenue to separately reflect Construction Revenue and the related Cost of Construction Revenue on the Company’s income statement. On the balance sheet, amounts due to the Company under the FirstNet Agreement have been segregated as Customer Receivable (within both the current and long-term asset sections of the balance sheet) and Customer Relationships, net are now included with Trade Names, net within Intangible assets, net. Use of Estimates The preparation of financial statements in conformity with accounting principles generally accepted in the United States requires management to make estimates and assumptions that affect the reported amounts of assets and liabilities and disclosure of contingent assets and liabilities at the dates of the financial statements and the reported amounts of revenue and expenses during the reporting periods. The most significant estimates relate to the allowance for credit losses on trade receivables, useful lives of the Company’s fixed and finite-lived intangible assets, allocation of purchase price to assets acquired and liabilities assumed in business combinations, fair value of indefinite-lived intangible assets, goodwill and income taxes. Actual results could differ significantly from those estimates. Cash and Cash Equivalents The Company considers all investments with an original maturity of three months or less at date of purchase to be cash equivalents. The Company places its cash and temporary investments with banks and other institutions that it believes have a high credit quality. At December 31, 2021, the Company had $19.9 million of its cash is on deposit with noninsured institutions such as corporate money market issuers and cash held in foreign banks. The Company’s cash and cash equivalents are not subject to any restrictions (see Note 8). As of December 31, 2021 and 2020, the Company held $5.5 million and $5.7 million, respectively, of its cash in Guyana dollars. While there are risks associated with the conversion of Guyana dollars to US dollars due to limited liquidity in the Guyana foreign currency markets, to date it has not prevented the Company from converting Guyana dollars into US dollars within a given three month period or from converting at a price that reasonably approximates the reported exchange rate. Restricted Cash The Company classifies cash that is legally restricted as to withdrawal or usage as restricted cash. Restricted cash as of December 31, 2021 and December 31, 2020 primarily relates to cash that is restricted for regulatory purposes. Short Term Investments The Company's short-term investments consist of corporate bonds, which have remaining maturities of more than three months at the date of purchase, and equity securities classified as available for sale, which are stated at fair value. Unrealized gains and losses are recorded in other income. The estimated fair values of investments are based on quoted market prices as of the end of the reporting period. Allowance for Credit Losses The Company adopted ASU 2016-13 on January 1, 2020. The standard requires that certain financial assets be measured at amortized cost reflecting an allowance for estimated credit losses expected to occur over the life of the assets. The estimate of credit losses is based on all releva
Free historical financial statements for ATN International Inc.. See how revenue, income, cash flow, and balance sheet financials have changed over 57 quarters since 2012. Compare with ATNI stock chart to see long term trends.
Data imported from ATN International Inc. SEC filings. Check original filings before making any investment decision.