Health Care › Electromedical And Electrotherapeutic Apparatus

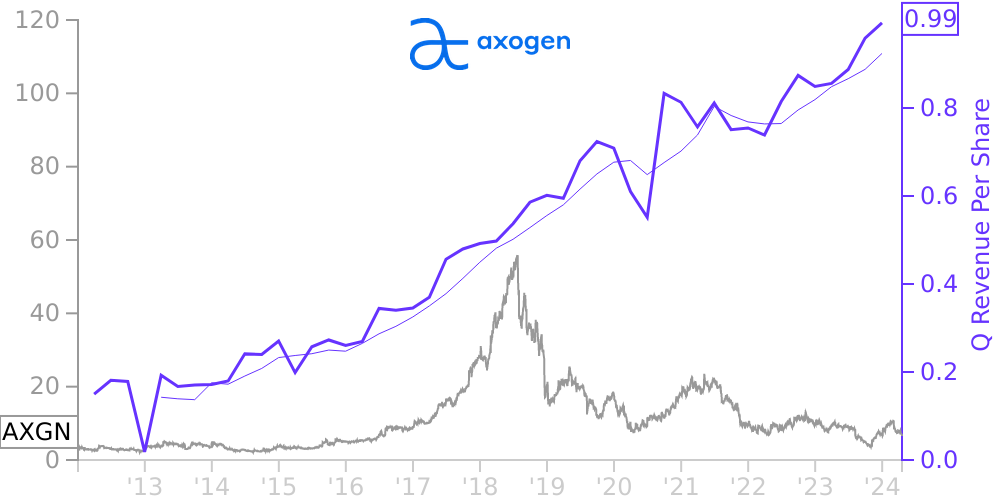
AXGN Stock Price Correlated With Axogen Financials
External Links ⌄
Income Statement
Cash Flow
Balance Sheet
AXGN Income Statement
Enable JavaScript and reload
Revenue, Net:
Cost of Goods & Services Sold:
Gross Profit:
Selling, General & Admin Expense:
Research & Development Expense:
Total Operating Expenses:
Operating Income:
Income Taxes:
Net Income:
AXGN Cash Flow
Enable JavaScript and reload
Operating Activities Net Income:
Depreciation, Depletion & Amortization:
Change in Accounts Receiveable:
Net Cash from Operations:
Repurchases/Buybacks Common Stock:
Issuance of Long-term Debt:
Cash Dividends Paid:
Net Cash from Financing Activities:
Property, Plant & Equipment Purchases:
Purchases of Businesses, Net of Cash:
Net Cash from Investing Activities:
Net Change in Cash & Equivalents:
AXGN Balance Sheet
Enable JavaScript and reload
Cash and Cash Equivalents:
Short-Term Investments:
Accounts Receivable, Net:
Inventories:
Total Current Assets:
Property, Plant & Equipment, Net:
Total Assets:
Accounts Payable:
Current Portion of Long-Term Debt:
Total Short-Term Liabilities:
Long Term Debt, Non-Current Portion:
Total Long-Term Liabilities:
Total Liabilities:
COMPANY PROFILE
1. Basis of Presentation
The accompanying condensed consolidated financial statements include the accounts of AxoGen, Inc. (the “Company” or
“AxoGen”) and its wholly owned subsidiary AxoGen Corporation (“AC”) as of March 31, 2012 and December 31, 2011 and for the three month periods ended March 31, 2012 and 2011. The Company’s condensed
consolidated financial statements have been prepared in accordance with accounting principles generally accepted in the United States of America and should be read in conjunction with the audited financial statements of the Company for the year
ended December 31, 2011, which are included in the Annual Report on Form 10-K for the year ended December 31, 2011. The interim condensed consolidated financial statements are unaudited and in the opinion of management, reflect all
adjustments necessary for a fair presentation of results for the periods presented. Results for interim periods are not necessarily indicative of results for the full year. All significant intercompany accounts and transactions have been eliminated
in consolidation. In October 2011, the Company moved its corporate headquarter facilities (principal executive office) from Texarkana, Texas to 13859 Progress Blvd., Suite 100, Alachua, Florida 32615.
Free historical financial statements for Axogen Inc. See how revenue, income, cash flow, and balance sheet financials have changed over 57 quarters since 2012. Compare with AXGN stock chart to see long term trends.
Data imported from Axogen Inc SEC filings. Check original filings before making any investment decision.