Health Care › Surgical And Medical Instruments And Apparatus

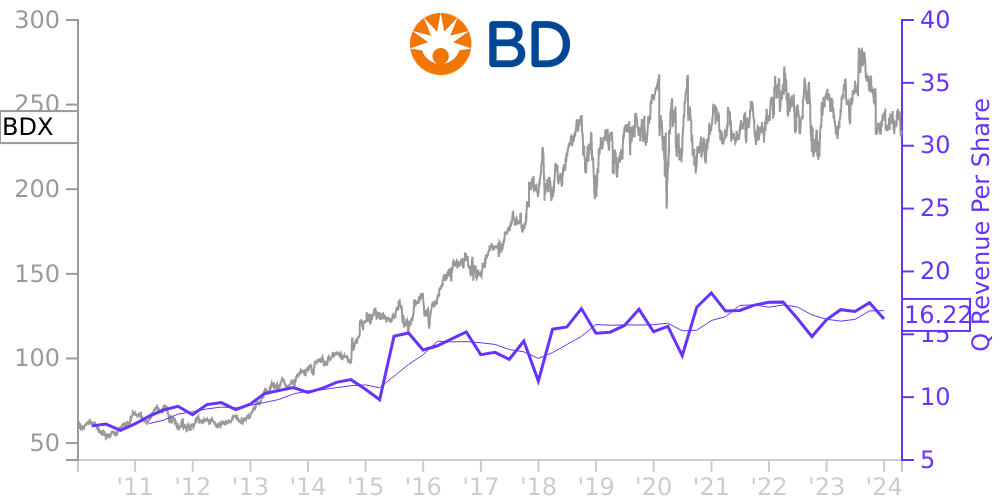
BDX Stock Price Correlated With Becton Dickinson and Co Financials
External Links ⌄
Income Statement
Cash Flow
Balance Sheet
BDX Income Statement
Enable JavaScript and reload
Revenue, Net:
Cost of Goods & Services Sold:
Gross Profit:
Selling, General & Admin Expense:
Research & Development Expense:
Total Operating Expenses:
Operating Income:
Income Taxes:
Net Income:
BDX Cash Flow
Enable JavaScript and reload
Operating Activities Net Income:
Depreciation, Depletion & Amortization:
Change in Accounts Receiveable:
Net Cash from Operations:
Repurchases/Buybacks Common Stock:
Issuance of Long-term Debt:
Cash Dividends Paid:
Net Cash from Financing Activities:
Property, Plant & Equipment Purchases:
Purchases of Businesses, Net of Cash:
Net Cash from Investing Activities:
Net Change in Cash & Equivalents:
BDX Balance Sheet
Enable JavaScript and reload
Cash and Cash Equivalents:
Short-Term Investments:
Accounts Receivable, Net:
Inventories:
Total Current Assets:
Property, Plant & Equipment, Net:
Total Assets:
Accounts Payable:
Current Portion of Long-Term Debt:
Total Short-Term Liabilities:
Long Term Debt, Non-Current Portion:
Total Long-Term Liabilities:
Total Liabilities:
COMPANY PROFILE
Summary of Significant Accounting Policies Basis of Presentation
The accompanying Consolidated Financial Statements and Notes to Consolidated Financial Statements of Becton, Dickinson and Company (the "Company" or "BD") have been prepared in accordance with U.S. generally accepted accounting principles ("U.S. GAAP"). Within the financial statements and tables presented, certain columns and rows may not add due to the use of rounded numbers for disclosure purposes. Percentages and earnings per share amounts presented are calculated from the underlying amounts. Our fiscal year ends on September 30.
Principles of Consolidation
The consolidated financial statements include the Company’s accounts and those of its majority-owned subsidiaries after the elimination of intercompany transactions. The Company has no material interests in variable interest entities.
Cash Equivalents
Cash equivalents consist of all highly liquid investments with a maturity of three months or less at time of purchase.
Restricted Cash
Restricted cash consists of cash restricted from withdrawal and usage and largely represents funds that are restricted for certain product liability matters assumed in the acquisition of C.R. Bard, Inc. ("Bard"), which are further discussed in Note 5.
Trade Receivables
The Company grants credit to customers in the normal course of business and the resulting trade receivables are stated at their net realizable value. The allowance for doubtful accounts represents the Company’s estimate of expected credit losses relating to trade receivables and is determined based on historical experience, current conditions, reasonable and supportable forecasts and other specific account data. Amounts are written off against the allowances for doubtful accounts when the Company determines that a customer account is uncollectable.
Inventories
Inventories are stated at the lower of approximate cost or net realizable value determined on the first-in, first-out basis.
Property, Plant and Equipment
Property, plant and equipment are stated at cost, less accumulated depreciation and amortization. Depreciation and amortization are principally provided on the straight-line basis over estimated useful lives, which range from 20 to 45 years for buildings, four to 13 years for machinery and equipment and one to 20 years for leasehold improvements. Depreciation and amortization expense was $731 million, $646 million and $633 million in fiscal years 2021, 2020 and 2019, respectively.
Goodwill and Other Intangible Assets
The Company’s unamortized intangible assets include goodwill which arise from acquisitions of businesses. The Company currently reviews goodwill for impairment using quantitative models. Goodwill is reviewed at least annually for impairment at the reporting unit level, which is defined as an operating segment or one level below an operating segment, referred to as a component. The Company’s reporting units generally represent one level below reporting segments. The Company’s review of goodwill for each reporting unit compares the fair value of the reporting unit, estimated using an income approach, with its carrying value. The annual impairment review performed on July 1, 2021 indicated that all identified reporting units’ fair values exceeded their respective carrying values.
Amortized intangible assets include developed technology assets which arise from acquisitions. These assets represent acquired intellectual property that is already technologically feasible upon the acquisition date or acquired in-process research and development assets that are completed subsequent to acquisition. Developed technology assets are generally amortized over periods ranging from 15 to 20 years, using the straight-line method. Customer relationship assets are generally amortized over periods ranging from 10 to 15 years, using the straight-line method. Other intangibles with finite useful lives, which include patents, are amorti
Free historical financial statements for Becton Dickinson and Co.. See how revenue, income, cash flow, and balance sheet financials have changed over 66 quarters since 2009. Compare with BDX stock chart to see long term trends.
Data imported from Becton Dickinson and Co. SEC filings. Check original filings before making any investment decision.