Financials › Services-Business Services, Nec

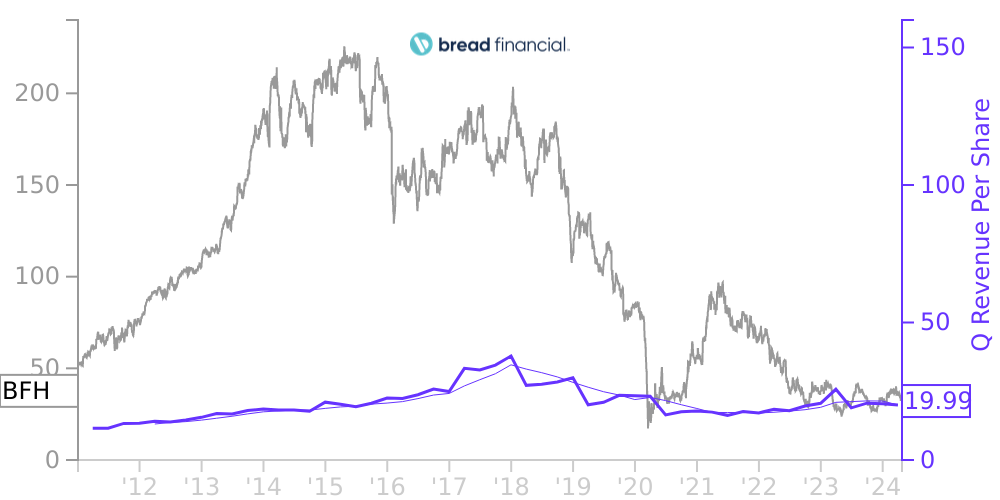
BFH Stock Price Correlated With Bread Financial Holdings Financials
External Links ⌄
Income Statement
Cash Flow
Balance Sheet
BFH Income Statement
Enable JavaScript and reload
Revenue, Net:
Cost of Goods & Services Sold:
Gross Profit:
Selling, General & Admin Expense:
Research & Development Expense:
Total Operating Expenses:
Operating Income:
Income Taxes:
Net Income:
BFH Cash Flow
Enable JavaScript and reload
Operating Activities Net Income:
Depreciation, Depletion & Amortization:
Change in Accounts Receiveable:
Net Cash from Operations:
Repurchases/Buybacks Common Stock:
Issuance of Long-term Debt:
Cash Dividends Paid:
Net Cash from Financing Activities:
Property, Plant & Equipment Purchases:
Purchases of Businesses, Net of Cash:
Net Cash from Investing Activities:
Net Change in Cash & Equivalents:
BFH Balance Sheet
Enable JavaScript and reload
Cash and Cash Equivalents:
Short-Term Investments:
Accounts Receivable, Net:
Inventories:
Total Current Assets:
Property, Plant & Equipment, Net:
Total Assets:
Accounts Payable:
Current Portion of Long-Term Debt:
Total Short-Term Liabilities:
Long Term Debt, Non-Current Portion:
Total Long-Term Liabilities:
Total Liabilities:
COMPANY PROFILE
1. BASIS OF PRESENTATION
The unaudited condensed consolidated financial statements included herein have been prepared by Alliance Data Systems Corporation (“ADSC” or, including its wholly owned subsidiaries and its consolidated variable interest entities, the “Company”), without audit, pursuant to the rules and regulations of the Securities and Exchange Commission (“SEC”). Certain information and footnote disclosures normally included in financial statements prepared in accordance with accounting principles generally accepted in the United States of America (“GAAP”) have been condensed or omitted pursuant to such rules and regulations. However, the Company believes that the disclosures are adequate to make the information presented not misleading. These unaudited condensed consolidated financial statements should be read in conjunction with the consolidated financial statements and the notes thereto included in the Company's Annual Report filed on Form 10-K for the year ended December 31, 2010, filed with the SEC on February 28, 2011. With respect to information concerning principal geographic areas, revenues are attributed to respective countries based on the location of the subsidiary, which generally correlates with the location of the customer.
The unaudited condensed consolidated financial statements included herein reflect all adjustments (consisting of normal, recurring adjustments) which are, in the opinion of management, necessary to state fairly the results for the interim periods presented. The results of operations for the interim periods presented are not necessarily indicative of the operating results to be expected for any subsequent interim period or for the fiscal year.
The preparation of financial statements in conformity with GAAP requires management to make estimates and assumptions that affect (1) the reported amounts of assets; (2) liabilities and disclosure of contingent assets and liabilities at the date of the financial statements; and (3) the reported amounts of revenues and expenses during the reporting period. Actual results could differ from those estimates. For purposes of comparability, fraud losses of $0.9 million have been reclassified from provision for loan loss to cost of operations in the prior period financial statements to conform to the current year presentation. Such reclassifications have no impact on previously reported net income.
Free historical financial statements for Bread Financial Holdings, Inc.. See how revenue, income, cash flow, and balance sheet financials have changed over 62 quarters since 2011. Compare with BFH stock chart to see long term trends.
Data imported from Bread Financial Holdings, Inc. SEC filings. Check original filings before making any investment decision.