Health Care › Pharmaceutical Preparations

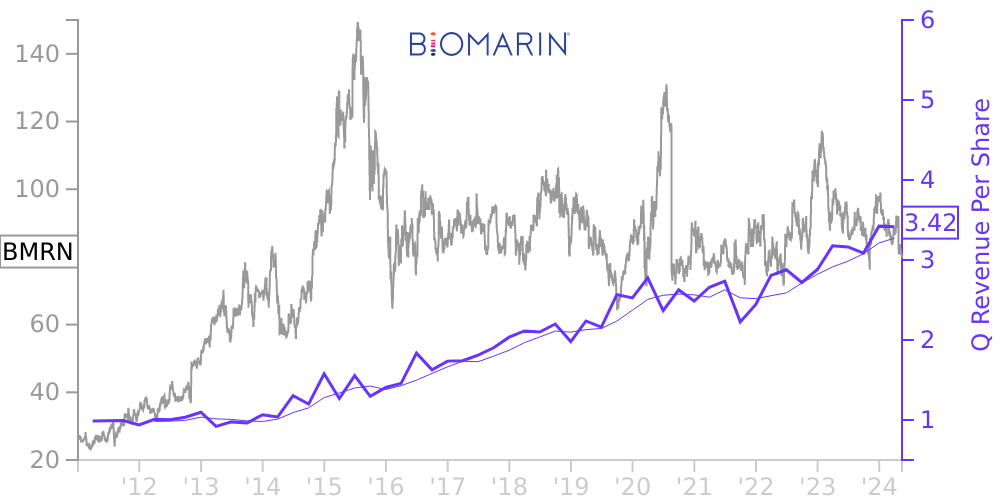
BMRN Stock Price Correlated With BioMarin Pharmaceutical Financials
External Links ⌄
Income Statement
Cash Flow
Balance Sheet
BMRN Income Statement
Enable JavaScript and reload
Revenue, Net:
Cost of Goods & Services Sold:
Gross Profit:
Selling, General & Admin Expense:
Research & Development Expense:
Total Operating Expenses:
Operating Income:
Income Taxes:
Net Income:
BMRN Cash Flow
Enable JavaScript and reload
Operating Activities Net Income:
Depreciation, Depletion & Amortization:
Change in Accounts Receiveable:
Net Cash from Operations:
Repurchases/Buybacks Common Stock:
Issuance of Long-term Debt:
Cash Dividends Paid:
Net Cash from Financing Activities:
Property, Plant & Equipment Purchases:
Purchases of Businesses, Net of Cash:
Net Cash from Investing Activities:
Net Change in Cash & Equivalents:
BMRN Balance Sheet
Enable JavaScript and reload
Cash and Cash Equivalents:
Short-Term Investments:
Accounts Receivable, Net:
Inventories:
Total Current Assets:
Property, Plant & Equipment, Net:
Total Assets:
Accounts Payable:
Current Portion of Long-Term Debt:
Total Short-Term Liabilities:
Long Term Debt, Non-Current Portion:
Total Long-Term Liabilities:
Total Liabilities:
COMPANY PROFILE
(1) NATURE OF OPERATIONS AND BUSINESS RISKS
BioMarin Pharmaceutical Inc. (the Company or BioMarin), a Delaware corporation, develops and commercializes innovative biopharmaceuticals for serious diseases and medical conditions. BioMarin selects product candidates for diseases and conditions that represent a significant unmet medical need, have well-understood biology and provide an opportunity to be first-to-market or offer a significant benefit over existing products. The Company's product portfolio is comprised of four approved products and multiple investigational product candidates. Approved products include Naglazyme (galsulfase), Kuvan (sapropterin dihydrochloride), Firdapse (amifampridine phosphate) and Aldurazyme (laronidase).
Through December 31, 2011, the Company had accumulated losses of approximately $425.1 million. Management believes that the Company's cash, cash equivalents and short-term and long-term investments at December 31, 2011 will be sufficient to meet the Company's obligations for the foreseeable future based on management's current long-term business plans and assuming that the Company achieves its long-term goals. If the Company elects to increase its spending on development programs significantly above current long-term plans or enters into potential licenses and other acquisitions of complementary technologies, products or companies, the Company may need additional capital. The Company expects to continue to finance net future cash needs that exceed its operating activities primarily through its current cash, cash equivalents, short-term and long-term investments, and to the extent necessary, through proceeds from equity or debt financings, loans and collaborative agreements with corporate partners.
The Company is subject to a number of risks, including the financial performance of Naglazyme, Kuvan, Firdapse and Aldurazyme; the potential need for additional financings; its ability to successfully commercialize its product candidates, if approved; the uncertainty of the Company's research and development efforts resulting in future successful commercial products; obtaining regulatory approval for new products; significant competition from larger organizations; reliance on the proprietary technology of others; dependence on key personnel; uncertain patent protection; dependence on corporate partners and collaborators; and possible restrictions on reimbursement from governmental agencies and healthcare organizations, as well as other changes in the health care industry.
Free historical financial statements for BioMarin Pharmaceutical Inc.. See how revenue, income, cash flow, and balance sheet financials have changed over 61 quarters since 2011. Compare with BMRN stock chart to see long term trends.
Data imported from BioMarin Pharmaceutical Inc. SEC filings. Check original filings before making any investment decision.