Financials › Fire, Marine And Casualty Insurance

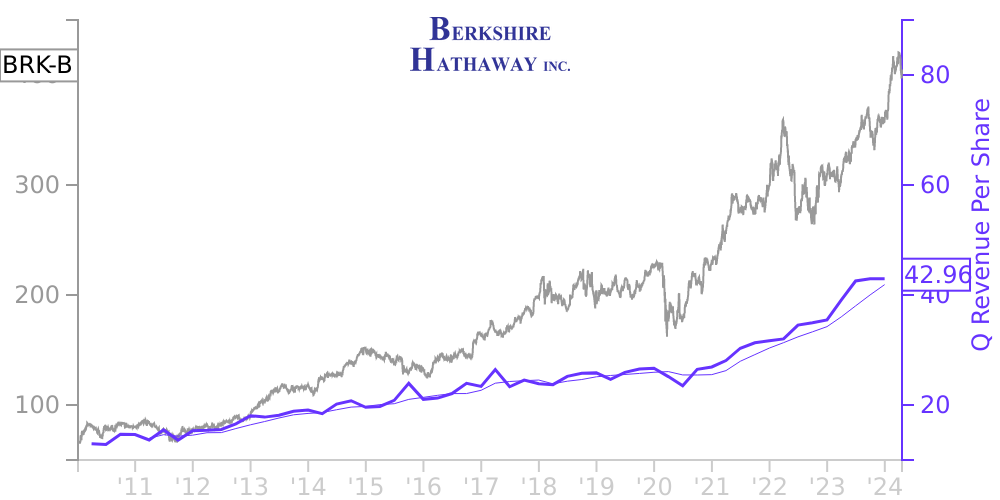
BRK-B Stock Price Correlated With Berkshire Hathaway Financials
External Links ⌄
Income Statement
Cash Flow
Balance Sheet
BRK-B Income Statement
Enable JavaScript and reload
Revenue, Net:
Cost of Goods & Services Sold:
Gross Profit:
Selling, General & Admin Expense:
Research & Development Expense:
Total Operating Expenses:
Operating Income:
Income Taxes:
Net Income:
BRK-B Cash Flow
Enable JavaScript and reload
Operating Activities Net Income:
Depreciation, Depletion & Amortization:
Change in Accounts Receiveable:
Net Cash from Operations:
Repurchases/Buybacks Common Stock:
Issuance of Long-term Debt:
Cash Dividends Paid:
Net Cash from Financing Activities:
Property, Plant & Equipment Purchases:
Purchases of Businesses, Net of Cash:
Net Cash from Investing Activities:
Net Change in Cash & Equivalents:
BRK-B Balance Sheet
Enable JavaScript and reload
Cash and Cash Equivalents:
Short-Term Investments:
Accounts Receivable, Net:
Inventories:
Total Current Assets:
Property, Plant & Equipment, Net:
Total Assets:
Accounts Payable:
Current Portion of Long-Term Debt:
Total Short-Term Liabilities:
Long Term Debt, Non-Current Portion:
Total Long-Term Liabilities:
Total Liabilities:
O'Sullivan Michael J. Senior Vice President, General Counsel and Secretary
536 sh at $467
$250,545
Buy
COMPANY PROFILE
Note 1. General
The accompanying unaudited Consolidated Financial Statements include the accounts of Berkshire Hathaway Inc. (“Berkshire” or “Company”) consolidated with the accounts of all its subsidiaries and affiliates in which Berkshire holds controlling financial interests as of the financial statement date. In these notes, the terms “us,” “we” or “our” refer to Berkshire and its consolidated subsidiaries. Reference is made to Berkshire’s most recently issued Annual Report on Form 10-K (“Annual Report”), which includes information necessary or useful to understanding Berkshire’s businesses and financial statement presentations. Our significant accounting policies and practices were presented as Note 1 to the Consolidated Financial Statements included in the Annual Report.
Financial information in this Quarterly Report reflects all adjustments (consisting only of normal recurring adjustments) that are, in the opinion of management, necessary to a fair statement of results for the interim periods in accordance with accounting principles generally accepted in the United States (“GAAP”). For a number of reasons, our results for interim periods are not normally indicative of results to be expected for the year. The timing and magnitude of catastrophe losses incurred by insurance subsidiaries and the estimation error inherent to the process of determining liabilities for unpaid losses of insurance subsidiaries can be more significant to results of interim periods than to results for a full year. Given the size of our equity security investment portfolio, changes in market prices and the related changes in unrealized gains and losses on equity securities will produce significant volatility in our interim and annual earnings. In addition, changes in the fair values of certain derivative contract liabilities, gains and losses from the periodic revaluation of certain assets and liabilities denominated in foreign currencies and the magnitude of asset impairment charges may cause significant variations in periodic net earnings.
The COVID-19 pandemic continues to affect most of our operating businesses. Significant government and private sector actions have been taken since 2020 and likely will continue to be taken intended to control the spread and mitigate the economic effects of the virus. Actions in the latter part of 2021 and early 2022 included temporary business closures or restrictions of business activities in various parts of the world in response to the emergence of variants of the virus. Notwithstanding these efforts, significant disruptions of supply chains and higher costs have persisted in 2022. Further, the development of geopolitical conflicts in 2022 have contributed to disruptions of supply chains, resulting in cost increases for commodities, goods, and services in many parts of the world. The economic effects from these events over longer terms cannot be reasonably estimated at this time. Accordingly, significant estimates used in the preparation of our financial statements, including those associated with evaluations of certain long-lived assets, goodwill and other intangible assets for impairment, expected credit losses on amounts owed to us and the estimations of certain losses assumed under insurance and reinsurance contracts, may be subject to significant adjustments in future periods.
Free historical financial statements for Berkshire Hathaway Inc. See how revenue, income, cash flow, and balance sheet financials have changed over 65 quarters since 2010. Compare with BRK-B stock chart to see long term trends.
Data imported from Berkshire Hathaway Inc SEC filings. Check original filings before making any investment decision.