Health Care › Laboratory Analytical Instruments
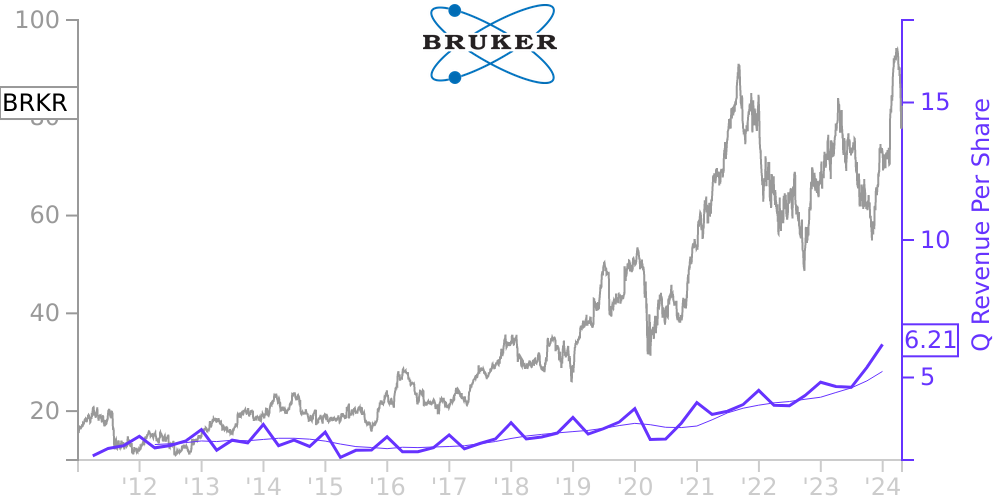
BRKR Stock Price Correlated With Bruker Financials
External Links ⌄
Income Statement
Cash Flow
Balance Sheet
BRKR Income Statement
Enable JavaScript and reload
Revenue, Net:
Cost of Goods & Services Sold:
Gross Profit:
Selling, General & Admin Expense:
Research & Development Expense:
Total Operating Expenses:
Operating Income:
Income Taxes:
Net Income:
BRKR Cash Flow
Enable JavaScript and reload
Operating Activities Net Income:
Depreciation, Depletion & Amortization:
Change in Accounts Receiveable:
Net Cash from Operations:
Repurchases/Buybacks Common Stock:
Issuance of Long-term Debt:
Cash Dividends Paid:
Net Cash from Financing Activities:
Property, Plant & Equipment Purchases:
Purchases of Businesses, Net of Cash:
Net Cash from Investing Activities:
Net Change in Cash & Equivalents:
BRKR Balance Sheet
Enable JavaScript and reload
Cash and Cash Equivalents:
Short-Term Investments:
Accounts Receivable, Net:
Inventories:
Total Current Assets:
Property, Plant & Equipment, Net:
Total Assets:
Accounts Payable:
Current Portion of Long-Term Debt:
Total Short-Term Liabilities:
Long Term Debt, Non-Current Portion:
Total Long-Term Liabilities:
Total Liabilities:
COMPANY PROFILE
1. Description of Business and Basis of Presentation
Bruker Corporation and its wholly-owned subsidiaries (Bruker or the Company) is a designer and manufacturer of proprietary life science and materials research systems and associated products that address the rapidly evolving needs of a diverse array of customers in life science, pharmaceutical, biotechnology, clinical and molecular diagnostics research, as well as in materials and chemical analysis in various industries and government applications. The Companys core technology platforms include X-ray technologies, magnetic resonance technologies, mass spectrometry technologies, optical emission spectroscopy and infrared and Raman molecular spectroscopy technologies. The Company also manufactures and distributes a broad range of field analytical systems for chemical, biological, radiological, nuclear and explosives, or CBRNE, detection. The Company also develops and manufactures superconducting and non-superconducting materials and devices for use in renewable energy, energy infrastructure, healthcare and big science research. The Company maintains major technical and manufacturing centers in Europe, North America and Japan, and has sales offices located throughout the world. The Companys diverse customer base includes life science, pharmaceutical, biotechnology and molecular diagnostic research companies, academic institutions, advanced materials and semiconductor manufacturers and government agencies.
Management reports results on the basis of the following two segments:
· Scientific Instruments. The operations of this segment include the design, manufacture and distribution of advanced instrumentation and automated solutions based on magnetic resonance technology, mass spectrometry technology, gas chromatography technology, X-ray technology, spark-optical emission spectroscopy technology, atomic force microscopy technology, stylus and optical metrology technology, and infrared and Raman molecular spectroscopy technology. Typical customers of the Scientific Instruments segment include: pharmaceutical, biotechnology and molecular diagnostic companies; academic institutions, medical schools and other non-profit organizations; clinical microbiology laboratories; government departments and agencies; nanotechnology, semiconductor, chemical, cement, metals and petroleum companies; and food, beverage and agricultural analysis companies and laboratories.
· Energy & Supercon Technologies. The operations of this segment include the design, manufacture and marketing of superconducting materials, primarily metallic low temperature superconductors, for use in magnetic resonance imaging, nuclear magnetic resonance, fusion energy research and other applications, and ceramic high temperature superconductors primarily for fusion energy research applications. Typical customers of the Energy & Supercon Technologies segment include companies in the medical industry, private and public research and development laboratories in the fields of fundamental and applied sciences and energy research and academic institutions and government agencies. The Energy & Supercon Technologies segment is also developing superconductors and superconducting-enabled devices for applications in power and energy, as well as industrial processing industries.
The Company has announced plans to sell a minority ownership position in its Bruker Energy & Supercon Technologies, Inc. (BEST) subsidiary through an initial public offering of the capital stock of BEST. The Company believes the offering will provide Bruker shareholders greater visibility into BESTs performance and growth and strengthen BESTs access to financing for its revenue growth initiatives, including the development of products for the renewable energy and energy infrastructure markets.
The financial statements represent the consolidated accounts of the Company. All significant intercompany accounts and transactions have been eliminated i
Free historical financial statements for Bruker Corp. See how revenue, income, cash flow, and balance sheet financials have changed over 61 quarters since 2011. Compare with BRKR stock chart to see long term trends.
Data imported from Bruker Corp SEC filings. Check original filings before making any investment decision.