Financials › Personal Credit Institutions

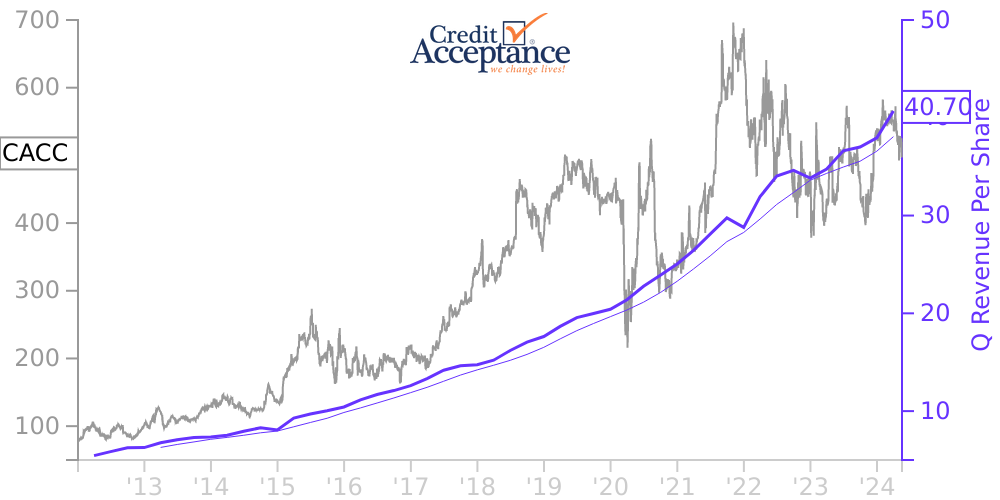
CACC Stock Price Correlated With Credit Acceptance Financials
External Links ⌄
Income Statement
Cash Flow
Balance Sheet
CACC Income Statement
Enable JavaScript and reload
Revenue, Net:
Cost of Goods & Services Sold:
Gross Profit:
Selling, General & Admin Expense:
Research & Development Expense:
Total Operating Expenses:
Operating Income:
Income Taxes:
Net Income:
CACC Cash Flow
Enable JavaScript and reload
Operating Activities Net Income:
Depreciation, Depletion & Amortization:
Change in Accounts Receiveable:
Net Cash from Operations:
Repurchases/Buybacks Common Stock:
Issuance of Long-term Debt:
Cash Dividends Paid:
Net Cash from Financing Activities:
Property, Plant & Equipment Purchases:
Purchases of Businesses, Net of Cash:
Net Cash from Investing Activities:
Net Change in Cash & Equivalents:
CACC Balance Sheet
Enable JavaScript and reload
Cash and Cash Equivalents:
Short-Term Investments:
Accounts Receivable, Net:
Inventories:
Total Current Assets:
Property, Plant & Equipment, Net:
Total Assets:
Accounts Payable:
Current Portion of Long-Term Debt:
Total Short-Term Liabilities:
Long Term Debt, Non-Current Portion:
Total Long-Term Liabilities:
Total Liabilities:
COMPANY PROFILE
BASIS OF PRESENTATION The accompanying unaudited consolidated financial statements have been prepared in accordance with accounting principles generally accepted in the United States of America (“generally accepted accounting principles” or “GAAP”) for interim financial information and with the instructions to Form 10-Q and Article 10 of Regulation S-X. Accordingly, they do not include all of the information and footnotes required by GAAP for complete financial statements. In the opinion of management, all adjustments (consisting of normal recurring accruals) considered necessary for a fair presentation have been included. The results of operations for interim periods are not necessarily indicative of actual results achieved for full fiscal years. The consolidated balance sheet as of December 31, 2021 has been derived from the audited financial statements at that date but does not include all the information and footnotes required by GAAP for complete financial statements. For further information, refer to the consolidated financial statements and footnotes thereto included in the Annual Report on Form 10-K for the year ended December 31, 2021 for Credit Acceptance Corporation (the “Company”, “Credit Acceptance”, “we”, “our” or “us”).
The preparation of financial statements in conformity with GAAP requires management to make estimates and assumptions that affect the amounts reported in the financial statements and accompanying notes. Actual results could differ from those estimates.
We have evaluated events and transactions occurring subsequent to the consolidated balance sheet date of March 31, 2022 for items that could potentially be recognized or disclosed in these financial statements. We did not identify any items that would require disclosure in or adjustment to the consolidated financial statements.
Free historical financial statements for Credit Acceptance Corp. See how revenue, income, cash flow, and balance sheet financials have changed over 57 quarters since 2012. Compare with CACC stock chart to see long term trends.
Data imported from Credit Acceptance Corp SEC filings. Check original filings before making any investment decision.