Consumer Staples › Retail-Auto Dealers And Gasoline Stations

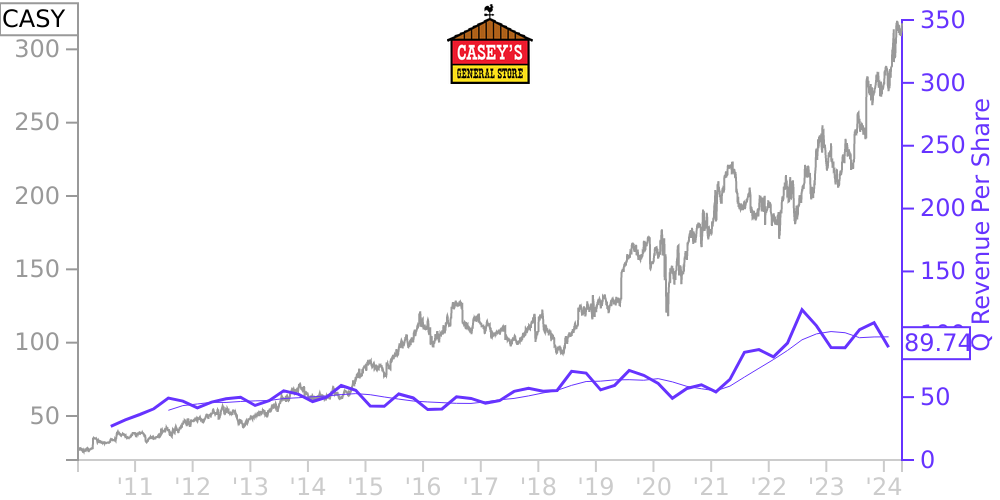
CASY Stock Price Correlated With Casey's General Stores Financials
External Links ⌄
Income Statement
Cash Flow
Balance Sheet
CASY Income Statement
Enable JavaScript and reload
Revenue, Net:
Cost of Goods & Services Sold:
Gross Profit:
Selling, General & Admin Expense:
Research & Development Expense:
Total Operating Expenses:
Operating Income:
Income Taxes:
Net Income:
CASY Cash Flow
Enable JavaScript and reload
Operating Activities Net Income:
Depreciation, Depletion & Amortization:
Change in Accounts Receiveable:
Net Cash from Operations:
Repurchases/Buybacks Common Stock:
Issuance of Long-term Debt:
Cash Dividends Paid:
Net Cash from Financing Activities:
Property, Plant & Equipment Purchases:
Purchases of Businesses, Net of Cash:
Net Cash from Investing Activities:
Net Change in Cash & Equivalents:
CASY Balance Sheet
Enable JavaScript and reload
Cash and Cash Equivalents:
Short-Term Investments:
Accounts Receivable, Net:
Inventories:
Total Current Assets:
Property, Plant & Equipment, Net:
Total Assets:
Accounts Payable:
Current Portion of Long-Term Debt:
Total Short-Term Liabilities:
Long Term Debt, Non-Current Portion:
Total Long-Term Liabilities:
Total Liabilities:
COMPANY PROFILE
Presentation of Financial Statements Casey’s General Stores, Inc. and its subsidiaries (hereinafter referred to as the "Company" or "Casey’s") operate 2,454 convenience stores in 16 states, primarily in the Midwest. Many of the stores are located in smaller communities, often with populations of less than 5,000.
The accompanying condensed consolidated financial statements include the accounts and transactions of Casey's General Stores, Inc. and its direct and indirect wholly-owned subsidiaries. All material intercompany balances and transactions have been eliminated in consolidation.
The accompanying condensed consolidated financial statements include the accounts and transactions of Casey's General Stores, Inc. and its direct and indirect wholly-owned subsidiaries. All material intercompany balances and transactions have been eliminated in consolidation.
Free historical financial statements for Casey's General Stores Inc.. See how revenue, income, cash flow, and balance sheet financials have changed over 64 quarters since 2010. Compare with CASY stock chart to see long term trends.
Data imported from Casey's General Stores Inc. SEC filings. Check original filings before making any investment decision.