Health Care › Services-Medical Laboratories

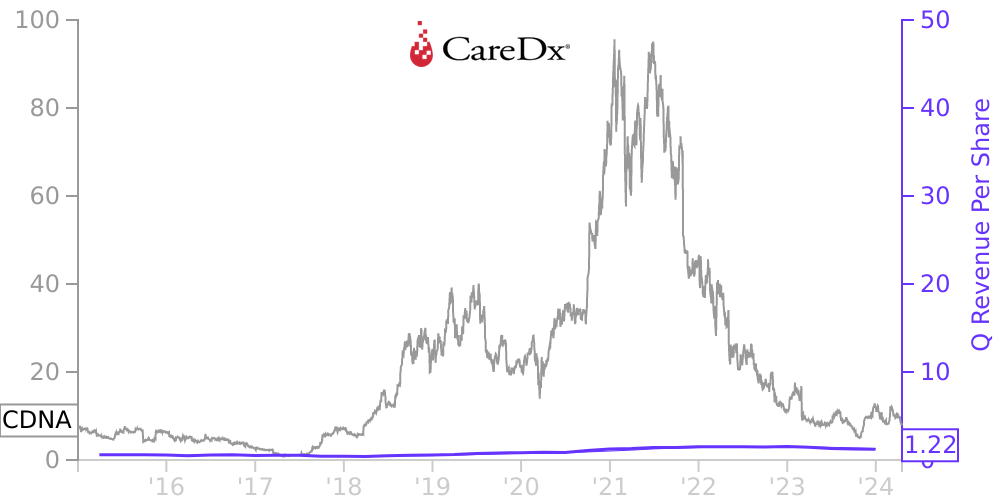
CDNA Stock Price Correlated With CareDx Financials
External Links ⌄
Income Statement
Cash Flow
Balance Sheet
CDNA Income Statement
Enable JavaScript and reload
Revenue, Net:
Cost of Goods & Services Sold:
Gross Profit:
Selling, General & Admin Expense:
Research & Development Expense:
Total Operating Expenses:
Operating Income:
Income Taxes:
Net Income:
CDNA Cash Flow
Enable JavaScript and reload
Operating Activities Net Income:
Depreciation, Depletion & Amortization:
Change in Accounts Receiveable:
Net Cash from Operations:
Repurchases/Buybacks Common Stock:
Issuance of Long-term Debt:
Cash Dividends Paid:
Net Cash from Financing Activities:
Property, Plant & Equipment Purchases:
Purchases of Businesses, Net of Cash:
Net Cash from Investing Activities:
Net Change in Cash & Equivalents:
CDNA Balance Sheet
Enable JavaScript and reload
Cash and Cash Equivalents:
Short-Term Investments:
Accounts Receivable, Net:
Inventories:
Total Current Assets:
Property, Plant & Equipment, Net:
Total Assets:
Accounts Payable:
Current Portion of Long-Term Debt:
Total Short-Term Liabilities:
Long Term Debt, Non-Current Portion:
Total Long-Term Liabilities:
Total Liabilities:
COMPANY PROFILE
ORGANIZATION AND DESCRIPTION OF BUSINESS CareDx, Inc. (“CareDx” or the “Company”), together with its subsidiaries, is a leading precision medicine company focused on the discovery, development and commercialization of clinically differentiated, high-value diagnostic solutions for transplant patients and caregivers. The Company’s headquarters are in South San Francisco, California. The primary operations are in Brisbane, California; Omaha, Nebraska; Fremantle, Australia; and Stockholm, Sweden.
The Company’s commercially available testing services consist of AlloSure® Kidney, a donor-derived cell-free DNA (“dd-cfDNA”) solution for kidney transplant patients, AlloMap® Heart, a gene expression solution for heart transplant patients, AlloSure® Heart, a dd-cfDNA solution for heart transplant patients, and AlloSure® Lung, a dd-cfDNA solution for lung transplant patients. The Company has initiated several clinical studies to generate data on its existing and planned future testing services. In April 2020, the Company announced its first biopharma research partnership for AlloCell, a surveillance solution that monitors the level of engraftment and persistence of allogeneic cells for patients who have received cell therapy transplants. The Company also offers high-quality products that increase the chance of successful transplants by facilitating a better match between a donor and a recipient of stem cells and organs. In 2019, the Company began providing digital solutions to transplant centers following the acquisitions of Ottr Complete Transplant Management (“Ottr, Inc.”) and XynManagement, Inc. (“XynManagement”), as well as the acquisitions of TransChart LLC (“TransChart”), MedActionPlan.com, LLC (“MedActionPlan”) and Transplant Pharmacy (“TTP”) in 2021 .
Testing Services
AlloSure Kidney has been a covered service for Medicare beneficiaries since October 2017. The Medicare reimbursement rate for AlloSure Kidney is currently $2,841. AlloSure Kidney has received positive coverage decisions from several commercial payers , and is reimbursed by other private payers on a case-by-case basis .
AlloMap Heart has been a covered service for Medicare beneficiaries since January 2006. The Medicare reimbursement rate for AlloMap Heart is currently $3,240. AlloMap Heart has also received positive coverage decisions for reimbursement from many of the largest U.S. private payers.
In October 2020, AlloSure Heart received a final Palmetto MolDx Medicare coverage decision for AlloSure Heart. In November 2020, Noridian Healthcare Solutions, the Company's Medicare Administrative contractor, issued a parallel coverage policy granting coverage when used in conjunction with AlloMap Heart, which became effective in December 2020. The Medicare reimbursement rate for AlloSure Heart is currently $2,753.
In May 2021, the Company purchased a minority investment of common stock in the biotechnology company Miromatrix Medical, Inc. (“Miromatrix”), for $5.0 million, and the investment is marked to market. Miromatrix works to eliminate the need for an organ transplant waiting list through the development of implantable engineered biological organs.
Clinical Studies
In January 2018, the Company initiated the Kidney Allograft Outcomes AlloSure Kidney Registry study ( “K-OAR” ), to develop additional data on the clinical utility of AlloSure Kidney for surveillance of kidney transplant recipients. K-OAR is a multicenter, non-blinded, prospective observational cohort study which has enrolled more than 1,700 renal transplant patients who will receive AlloSure Kidney long-term surveillance.
In September 2018, the Company initiated the Surveillance HeartCare ™ Outcomes Registry (“SHORE”). SHORE is a prospective, multi-center, observational registry of patients receiving HeartCare for surveillance. HeartCare combines the gene expression profiling technology of AlloMap Heart with the dd-cfDNA analysis of AlloSure ® Heart in one surveillance solution.
In February 2019
Free historical financial statements for CareDx Inc.. See how revenue, income, cash flow, and balance sheet financials have changed over 45 quarters since 2015. Compare with CDNA stock chart to see long term trends.
Data imported from CareDx Inc. SEC filings. Check original filings before making any investment decision.