Consumer Staples › Wholesale-Groceries And General Line

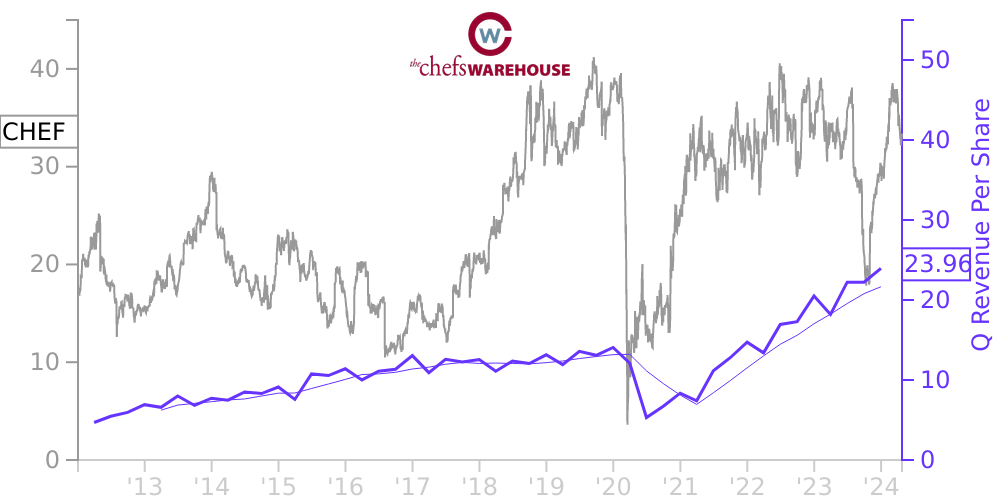
CHEF Stock Price Correlated With Chefs' Warehouse Financials
External Links ⌄
Income Statement
Cash Flow
Balance Sheet
CHEF Income Statement
Enable JavaScript and reload
Revenue, Net:
Cost of Goods & Services Sold:
Gross Profit:
Selling, General & Admin Expense:
Research & Development Expense:
Total Operating Expenses:
Operating Income:
Income Taxes:
Net Income:
CHEF Cash Flow
Enable JavaScript and reload
Operating Activities Net Income:
Depreciation, Depletion & Amortization:
Change in Accounts Receiveable:
Net Cash from Operations:
Repurchases/Buybacks Common Stock:
Issuance of Long-term Debt:
Cash Dividends Paid:
Net Cash from Financing Activities:
Property, Plant & Equipment Purchases:
Purchases of Businesses, Net of Cash:
Net Cash from Investing Activities:
Net Change in Cash & Equivalents:
CHEF Balance Sheet
Enable JavaScript and reload
Cash and Cash Equivalents:
Short-Term Investments:
Accounts Receivable, Net:
Inventories:
Total Current Assets:
Property, Plant & Equipment, Net:
Total Assets:
Accounts Payable:
Current Portion of Long-Term Debt:
Total Short-Term Liabilities:
Long Term Debt, Non-Current Portion:
Total Long-Term Liabilities:
Total Liabilities:
COMPANY PROFILE
Operations and Basis of Presentation
Description of Business and Basis of Presentation
The financial statements include the consolidated accounts of The Chefs’ Warehouse, Inc. (the “Company”), and its wholly-owned subsidiaries. The Company’s quarterly periods end on the thirteenth Friday of each quarter. Every six to seven years the Company will add a fourteenth week to its fourth quarter to more closely align its year end to the calendar year. The Company’s business consists of three operating segments: East Coast, Midwest and West Coast that aggregate into one reportable segment, food product distribution, which is concentrated in the United States. The Company’s customer base consists primarily of menu-driven independent restaurants, fine dining establishments, country clubs, hotels, caterers, culinary schools, bakeries, patisseries, chocolateries, cruise lines, casinos and specialty food stores.
The COVID-19 Pandemic
The COVID-19 pandemic (the “Pandemic”), has had and continues to have an adverse impact on numerous aspects of the Company’s business and those of its customers including, but not limited to, demand for the Company’s products, cost inflation and labor shortages.
The future impact of the Pandemic on the Company’s business, operations and liquidity is difficult to predict at this time and is highly dependent on future developments including new information that may emerge on the severity or transmissibility of the disease, new variants, government responses, trends in infection rates, development and distribution of effective medical treatments and vaccines, and future consumer spending behavior, among others.
Consolidation
The consolidated financial statements include all the accounts of the Company and its direct and indirect wholly-owned subsidiaries. All significant intercompany accounts and transactions have been eliminated.
Guidance Adopted in Fiscal 2021
Simplifying the Accounting for Income Taxes : In December 2019, the Financial Accounting Standards Board (the “FASB”) issued guidance that eliminates certain exceptions related to the approach for intraperiod tax allocations, the methodology for calculating income taxes in an interim period and other simplifications and clarifications. As a result of the new guidance, the Company may recognize additional income tax benefits during interim periods in which interim losses exceed full year projections due to provisions in the guidance that remove loss limitation rules. This guidance was adopted on December 26, 2020 and adoption had an immaterial impact on the Company’s consolidated financial statements.
Accounting for Convertible Instruments and Contracts in an Entity’s Own Equity : In August 2020, the FASB issued guidance that simplifies the accounting models for financial instruments with characteristics of debt and equity. The amendments in the guidance result in fewer instances in which an embedded conversion feature must be accounted for separately from its host contract. This guidance will be effective for fiscal years beginning after December 15, 2021. This guidance was adopted on December 26, 2020 and adoption did not impact the Company’s consolidated financial statements.
Guidance Not Yet Adopted
There is no recent accounting guidance not yet adopted that is expected to have a material impact on the Company’s financial statements when adopted.
Use of Estimates
The preparation of the Company’s consolidated financial statements in conformity with generally accepted accounting principles requires it to make estimates and assumptions that affect reported amounts of assets, liabilities, revenues, expenses and disclosure of contingent assets and liabilities. Estimates are used in determining, among other items, the allowance for doubtful accounts, inventory valuation adjustments, self-insurance reserves for group medical insurance, workers’ compensation insurance and automobile liability insurance, future cash flows associated with impairmen
Free historical financial statements for Chefs' Warehouse Inc.. See how revenue, income, cash flow, and balance sheet financials have changed over 57 quarters since 2012. Compare with CHEF stock chart to see long term trends.
Data imported from Chefs' Warehouse Inc. SEC filings. Check original filings before making any investment decision.