Consumer Staples › Perfumes, Cosmetics And Other Toilet Preparations

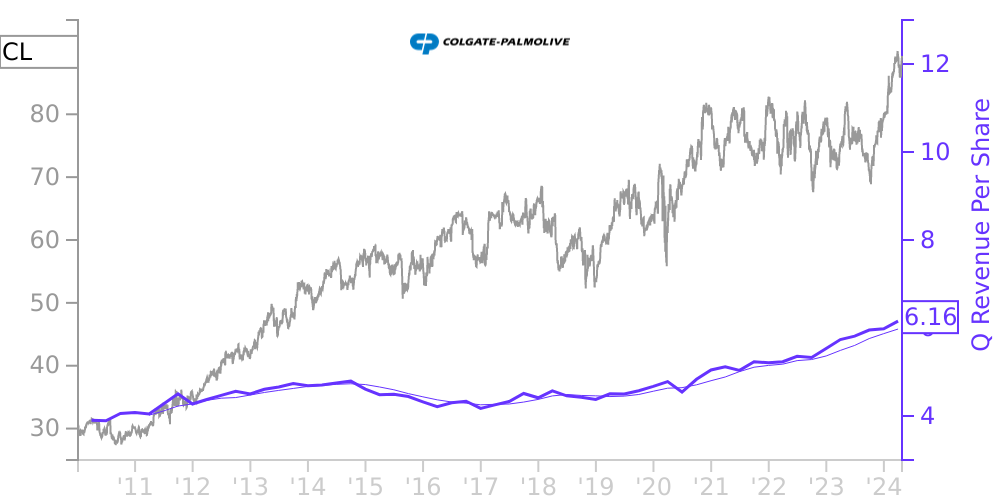
CL Stock Price Correlated With Colgate-Palmolive Co Financials
External Links ⌄
Income Statement
Cash Flow
Balance Sheet
CL Income Statement
Enable JavaScript and reload
Revenue, Net:
Cost of Goods & Services Sold:
Gross Profit:
Selling, General & Admin Expense:
Research & Development Expense:
Total Operating Expenses:
Operating Income:
Income Taxes:
Net Income:
CL Cash Flow
Enable JavaScript and reload
Operating Activities Net Income:
Depreciation, Depletion & Amortization:
Change in Accounts Receiveable:
Net Cash from Operations:
Repurchases/Buybacks Common Stock:
Issuance of Long-term Debt:
Cash Dividends Paid:
Net Cash from Financing Activities:
Property, Plant & Equipment Purchases:
Purchases of Businesses, Net of Cash:
Net Cash from Investing Activities:
Net Change in Cash & Equivalents:
CL Balance Sheet
Enable JavaScript and reload
Cash and Cash Equivalents:
Short-Term Investments:
Accounts Receivable, Net:
Inventories:
Total Current Assets:
Property, Plant & Equipment, Net:
Total Assets:
Accounts Payable:
Current Portion of Long-Term Debt:
Total Short-Term Liabilities:
Long Term Debt, Non-Current Portion:
Total Long-Term Liabilities:
Total Liabilities:
COMPANY PROFILE
Basis of Presentation The Condensed Consolidated Financial Statements reflect all normal recurring adjustments which, in management’s opinion, are necessary for a fair statement of the results for interim periods. Results of operations for interim periods may not be representative of results to be expected for a full year. Colgate-Palmolive Company (together with its subsidiaries, the “Company” or “Colgate”) reclassifies certain prior year amounts, as applicable, to conform to the current year presentation.
For a complete set of financial statement notes, including the Company’s significant accounting policies, refer to the Company’s Annual Report on Form 10-K for the year ended December 31, 2021, filed with the Securities and Exchange Commission (the “SEC”).
For a complete set of financial statement notes, including the Company’s significant accounting policies, refer to the Company’s Annual Report on Form 10-K for the year ended December 31, 2021, filed with the Securities and Exchange Commission (the “SEC”).
Free historical financial statements for Colgate-Palmolive Co.. See how revenue, income, cash flow, and balance sheet financials have changed over 65 quarters since 2010. Compare with CL stock chart to see long term trends.
Data imported from Colgate-Palmolive Co. SEC filings. Check original filings before making any investment decision.