Financials › Security And Commodity Brokers, Dealers, Exchanges And Services

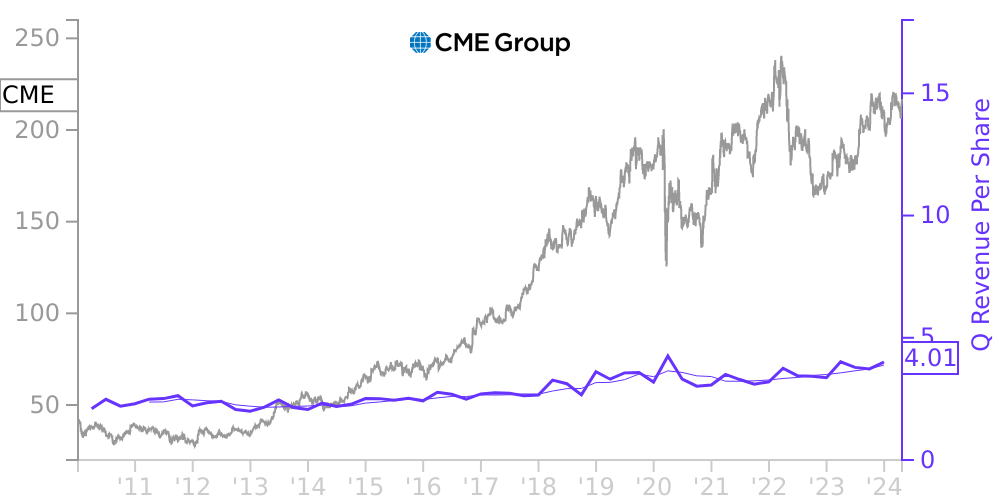
CME Stock Price Correlated With CME Financials
External Links ⌄
Income Statement
Cash Flow
Balance Sheet
CME Income Statement
Enable JavaScript and reload
Revenue, Net:
Cost of Goods & Services Sold:
Gross Profit:
Selling, General & Admin Expense:
Research & Development Expense:
Total Operating Expenses:
Operating Income:
Income Taxes:
Net Income:
CME Cash Flow
Enable JavaScript and reload
Operating Activities Net Income:
Depreciation, Depletion & Amortization:
Change in Accounts Receiveable:
Net Cash from Operations:
Repurchases/Buybacks Common Stock:
Issuance of Long-term Debt:
Cash Dividends Paid:
Net Cash from Financing Activities:
Property, Plant & Equipment Purchases:
Purchases of Businesses, Net of Cash:
Net Cash from Investing Activities:
Net Change in Cash & Equivalents:
CME Balance Sheet
Enable JavaScript and reload
Cash and Cash Equivalents:
Short-Term Investments:
Accounts Receivable, Net:
Inventories:
Total Current Assets:
Property, Plant & Equipment, Net:
Total Assets:
Accounts Payable:
Current Portion of Long-Term Debt:
Total Short-Term Liabilities:
Long Term Debt, Non-Current Portion:
Total Long-Term Liabilities:
Total Liabilities:
COMPANY PROFILE
ORGANIZATION AND BUSINESS CME Group Inc. (CME Group) exchanges offer the widest range of global benchmark products across all major asset classes based on interest rates, equity indexes, foreign exchange (FX), agricultural, energy and metal commodities. We offer futures and options trading across asset classes through the CME Globex platform, cash and repo fixed income trading via BrokerTec, and cash and OTC FX trading via EBS. In addition, it operates one of the world’s leading central counterparty clearing houses. CME Group offers clearing, settlement and guarantees for all products cleared through the clearing house.
Chicago Mercantile Exchange Inc. (CME), the Board of Trade of the City of Chicago, Inc. (CBOT), New York Mercantile Exchange, Inc. (NYMEX) and Commodity Exchange, Inc. (COMEX), wholly-owned subsidiaries of CME Group, are designated contract markets for the trading of futures and options contracts.
In January 2021, the company announced that it agreed with IHS Markit to combine their post-trade services into a new joint venture. The joint venture, OSTTRA, was launched in September 2021. OSTTRA performs trade processing and risk mitigation services. The company contributed the net assets of its optimization business, which included Traiana, TriOptima and Reset, to the new joint venture and deconsolidated the net assets of the optimization business. The financial statements and accompanying notes presented in this report exclude the assets, liabilities, revenues and expenses from the optimization business and include an investment in the joint venture and equity in net earnings from the joint venture after September 2021.
CME Group and its subsidiaries are referred to collectively as "the company" in the notes to the consolidated financial statements.
Free historical financial statements for CME Group Inc. See how revenue, income, cash flow, and balance sheet financials have changed over 66 quarters since 2010. Compare with CME stock chart to see long term trends.
Data imported from CME Group Inc SEC filings. Check original filings before making any investment decision.