Health Care › Hospital And Medical Service Plans

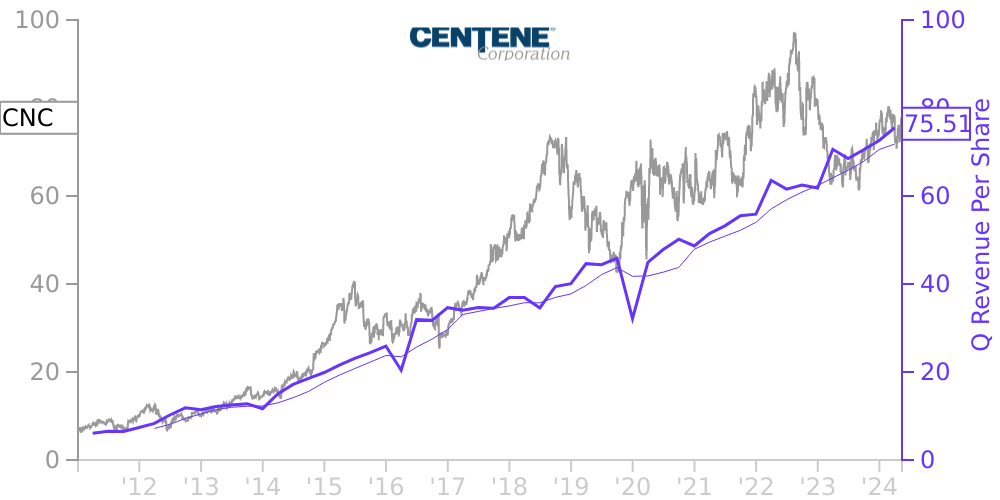
CNC Stock Price Correlated With Centene Financials
External Links ⌄
Income Statement
Cash Flow
Balance Sheet
CNC Income Statement
Enable JavaScript and reload
Revenue, Net:
Cost of Goods & Services Sold:
Gross Profit:
Selling, General & Admin Expense:
Research & Development Expense:
Total Operating Expenses:
Operating Income:
Income Taxes:
Net Income:
CNC Cash Flow
Enable JavaScript and reload
Operating Activities Net Income:
Depreciation, Depletion & Amortization:
Change in Accounts Receiveable:
Net Cash from Operations:
Repurchases/Buybacks Common Stock:
Issuance of Long-term Debt:
Cash Dividends Paid:
Net Cash from Financing Activities:
Property, Plant & Equipment Purchases:
Purchases of Businesses, Net of Cash:
Net Cash from Investing Activities:
Net Change in Cash & Equivalents:
CNC Balance Sheet
Enable JavaScript and reload
Cash and Cash Equivalents:
Short-Term Investments:
Accounts Receivable, Net:
Inventories:
Total Current Assets:
Property, Plant & Equipment, Net:
Total Assets:
Accounts Payable:
Current Portion of Long-Term Debt:
Total Short-Term Liabilities:
Long Term Debt, Non-Current Portion:
Total Long-Term Liabilities:
Total Liabilities:
COMPANY PROFILE
1. Basis of Presentation
The accompanying interim financial statements have been prepared under the presumption that users of the interim financial information have either read or have access to the audited financial statements for the fiscal year ended December 31, 2010 filed on Form 10-K on February 22, 2011. The unaudited interim financial statements herein have been prepared pursuant to the rules and regulations of the Securities and Exchange Commission. Accordingly, footnote disclosures, which would substantially duplicate the disclosures contained in the December 31, 2010 audited financial statements, have been omitted from these interim financial statements where appropriate. In the opinion of management, these financial statements reflect all adjustments, consisting only of normal recurring adjustments, which are necessary for a fair presentation of the results of the interim periods presented.
Certain 2010 amounts in the consolidated financial statements have been reclassified to conform to the 2011 presentation. These reclassifications have no effect on net earnings or stockholders' equity as previously reported.
Free historical financial statements for Centene Corp. See how revenue, income, cash flow, and balance sheet financials have changed over 61 quarters since 2011. Compare with CNC stock chart to see long term trends.
Data imported from Centene Corp SEC filings. Check original filings before making any investment decision.