Health Care › Electromedical And Electrotherapeutic Apparatus

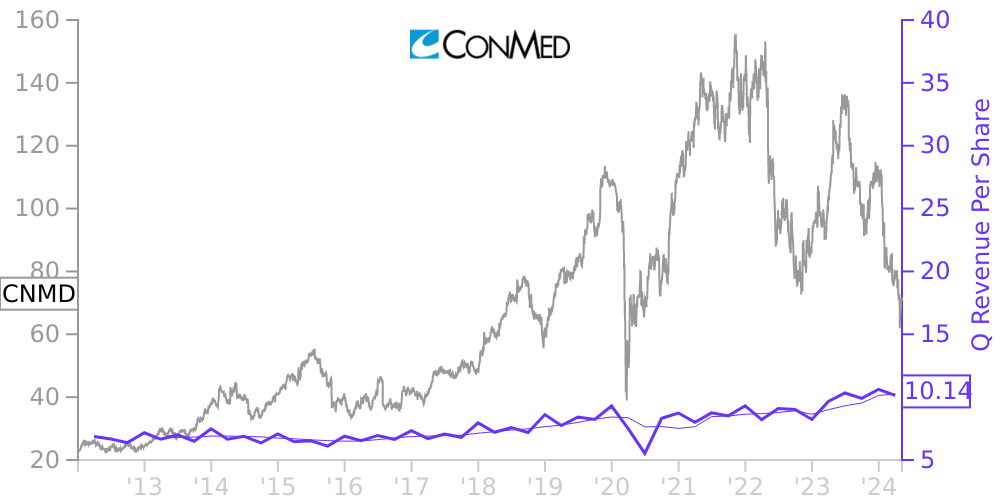
CNMD Stock Price Correlated With CONMED Financials
External Links ⌄
Income Statement
Cash Flow
Balance Sheet
CNMD Income Statement
Enable JavaScript and reload
Revenue, Net:
Cost of Goods & Services Sold:
Gross Profit:
Selling, General & Admin Expense:
Research & Development Expense:
Total Operating Expenses:
Operating Income:
Income Taxes:
Net Income:
CNMD Cash Flow
Enable JavaScript and reload
Operating Activities Net Income:
Depreciation, Depletion & Amortization:
Change in Accounts Receiveable:
Net Cash from Operations:
Repurchases/Buybacks Common Stock:
Issuance of Long-term Debt:
Cash Dividends Paid:
Net Cash from Financing Activities:
Property, Plant & Equipment Purchases:
Purchases of Businesses, Net of Cash:
Net Cash from Investing Activities:
Net Change in Cash & Equivalents:
CNMD Balance Sheet
Enable JavaScript and reload
Cash and Cash Equivalents:
Short-Term Investments:
Accounts Receivable, Net:
Inventories:
Total Current Assets:
Property, Plant & Equipment, Net:
Total Assets:
Accounts Payable:
Current Portion of Long-Term Debt:
Total Short-Term Liabilities:
Long Term Debt, Non-Current Portion:
Total Long-Term Liabilities:
Total Liabilities:
COMPANY PROFILE
Interim Financial Information The accompanying unaudited consolidated condensed financial statements have been prepared in accordance with generally accepted accounting principles for interim financial information and with the instructions to Form 10-Q and Article 10 of Regulation S-X. Accordingly, they do not include all of the information and footnotes required by generally accepted accounting principles for annual financial statements. The information herein reflects all normal recurring material adjustments, which are, in the opinion of management, necessary to fairly present the results for the periods presented. The consolidated condensed financial statements herein consist of all wholly-owned domestic and foreign subsidiaries with all significant intercompany transactions eliminated. Results for the period ended March 31, 2022 are not necessarily indicative of the results that may be expected for the year ending December 31, 2022.
The consolidated condensed financial statements and notes thereto should be read in conjunction with the consolidated financial statements and notes for the year ended December 31, 2021 included in our Annual Report on Form 10-K.
Use of Estimates
Preparation of the consolidated condensed financial statements in conformity with U.S. GAAP requires management to make estimates and assumptions that affect the reported amounts of assets and liabilities and disclosure of contingent assets and liabilities at the date of the consolidated condensed financial statements and the reported amounts of revenue and expenses during the reporting period.
Due to the COVID-19 pandemic, there has been uncertainty and disruption in the global economy and financial markets. We are not aware of any specific event or circumstance that would require an update to our estimates or judgments or a revision of the carrying value of our assets or liabilities as of May 5, 2022, the date of issuance of this Quarterly Report on Form 10-Q. These estimates may change, as new events occur and additional information is obtained. Actual results could differ materially from these estimates under different assumptions or conditions.
Free historical financial statements for CONMED Corp.. See how revenue, income, cash flow, and balance sheet financials have changed over 57 quarters since 2012. Compare with CNMD stock chart to see long term trends.
Data imported from CONMED Corp. SEC filings. Check original filings before making any investment decision.