Financials › Investment Advice

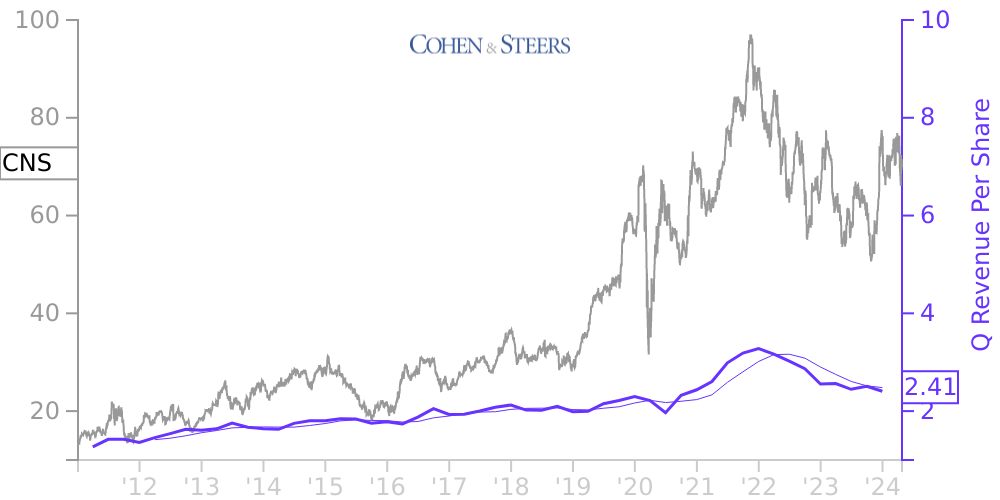
CNS Stock Price Correlated With Cohen & Steers Financials
External Links ⌄
Income Statement
Cash Flow
Balance Sheet
CNS Income Statement
Enable JavaScript and reload
Revenue, Net:
Cost of Goods & Services Sold:
Gross Profit:
Selling, General & Admin Expense:
Research & Development Expense:
Total Operating Expenses:
Operating Income:
Income Taxes:
Net Income:
CNS Cash Flow
Enable JavaScript and reload
Operating Activities Net Income:
Depreciation, Depletion & Amortization:
Change in Accounts Receiveable:
Net Cash from Operations:
Repurchases/Buybacks Common Stock:
Issuance of Long-term Debt:
Cash Dividends Paid:
Net Cash from Financing Activities:
Property, Plant & Equipment Purchases:
Purchases of Businesses, Net of Cash:
Net Cash from Investing Activities:
Net Change in Cash & Equivalents:
CNS Balance Sheet
Enable JavaScript and reload
Cash and Cash Equivalents:
Short-Term Investments:
Accounts Receivable, Net:
Inventories:
Total Current Assets:
Property, Plant & Equipment, Net:
Total Assets:
Accounts Payable:
Current Portion of Long-Term Debt:
Total Short-Term Liabilities:
Long Term Debt, Non-Current Portion:
Total Long-Term Liabilities:
Total Liabilities:
COMPANY PROFILE
Basis of Presentation Cohen & Steers, Inc. (CNS) was organized as a Delaware corporation on March 17, 2004. CNS is the holding company for its direct and indirect subsidiaries, including Cohen & Steers Capital Management, Inc. (CSCM), Cohen & Steers Securities, LLC (CSS), Cohen & Steers UK Limited (CSUK), Cohen & Steers Ireland Limited (CSIL), Cohen & Steers Asia Limited (CSAL) and Cohen & Steers Japan Limited (CSJL) (collectively, the Company).
The Company is a global investment manager specializing in real assets and alternative income, including real estate, preferred securities, infrastructure, resource equities, commodities, as well as multi-strategy solutions. Founded in 1986, the Company is headquartered in New York City, with offices in London, Dublin, Hong Kong and Tokyo.
The consolidated financial statements have been prepared in accordance with accounting principles generally accepted in the United States of America (GAAP). The consolidated financial statements set forth herein include the accounts of CNS and its direct and indirect subsidiaries. Intercompany balances and transactions have been eliminated in consolidation.
Free historical financial statements for Cohen & Steers Inc.. See how revenue, income, cash flow, and balance sheet financials have changed over 61 quarters since 2011. Compare with CNS stock chart to see long term trends.
Data imported from Cohen & Steers Inc. SEC filings. Check original filings before making any investment decision.