Consumer Staples › Food And Kindred Products

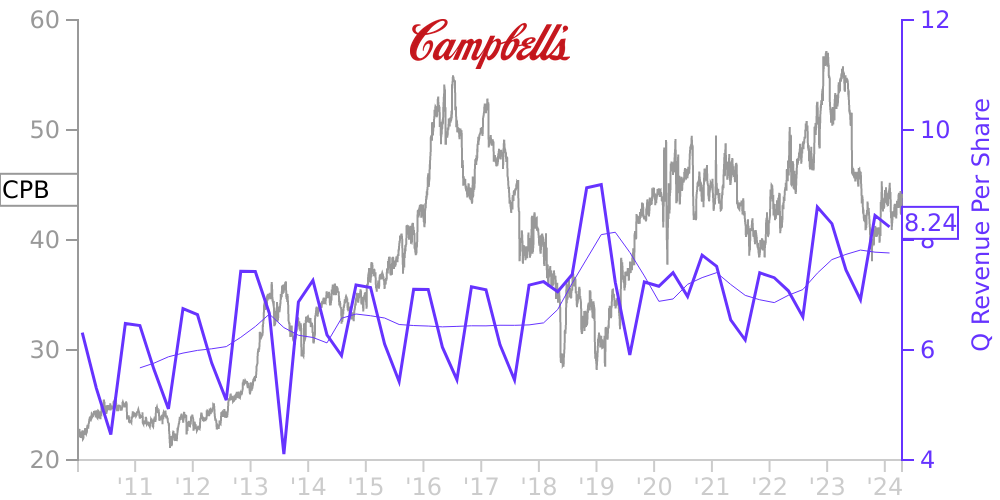
CPB Stock Price Correlated With Campbell Soup Co Financials
External Links ⌄
Income Statement
Cash Flow
Balance Sheet
CPB Income Statement
Enable JavaScript and reload
Revenue, Net:
Cost of Goods & Services Sold:
Gross Profit:
Selling, General & Admin Expense:
Research & Development Expense:
Total Operating Expenses:
Operating Income:
Income Taxes:
Net Income:
CPB Cash Flow
Enable JavaScript and reload
Operating Activities Net Income:
Depreciation, Depletion & Amortization:
Change in Accounts Receiveable:
Net Cash from Operations:
Repurchases/Buybacks Common Stock:
Issuance of Long-term Debt:
Cash Dividends Paid:
Net Cash from Financing Activities:
Property, Plant & Equipment Purchases:
Purchases of Businesses, Net of Cash:
Net Cash from Investing Activities:
Net Change in Cash & Equivalents:
CPB Balance Sheet
Enable JavaScript and reload
Cash and Cash Equivalents:
Short-Term Investments:
Accounts Receivable, Net:
Inventories:
Total Current Assets:
Property, Plant & Equipment, Net:
Total Assets:
Accounts Payable:
Current Portion of Long-Term Debt:
Total Short-Term Liabilities:
Long Term Debt, Non-Current Portion:
Total Long-Term Liabilities:
Total Liabilities:
COMPANY PROFILE
Summary of Significant Accounting Policies In this Report, unless otherwise stated, the terms "we," "us," "our" and the "company" refer to Campbell Soup Company and its consolidated subsidiaries.
We are a manufacturer and marketer of high-quality, branded food and beverage products.
Basis of Presentation — The consolidated financial statements include our accounts and entities in which we maintain a controlling financial interest and a variable interest entity (VIE) for which we were the primary beneficiary. Intercompany transactions are eliminated in consolidation. Our fiscal year ends on the Sunday nearest July 31. There were 52 weeks in 2021 and 2019, and 53 weeks in 2020.
Discontinued Operations — We present discontinued operations when there is a disposal of a component group or a group of components that in our judgment represents a strategic shift that will have a major effect on our operations and financial results. We aggregate the results of operations for discontinued operations into a single line item in the Consolidated Statements of Earnings for all periods presented. General corporate overhead is not allocated to discontinued operations. See Note 3 for additional information.
Use of Estimates — Generally accepted accounting principles require management to make estimates and assumptions that affect assets, liabilities, revenues and expenses. Actual results could differ from those estimates.
Revenue Recognition — Our revenues primarily consist of the sale of food and beverage products through our own sales force and/or third-party brokers and distribution partners. Revenues are recognized when our performance obligation has been satisfied and control of the product passes to our customers, which typically occurs when products are delivered or accepted by customers in accordance with terms of agreements. We make shipments promptly after acceptance of orders. Shipping and handling costs incurred to deliver the product are recorded within Cost of products sold. Amounts billed and due from our customers are classified as Accounts receivable in the Consolidated Balance Sheets and require payment on a short-term basis. Revenues are recognized net of provisions for returns, discounts and certain sales promotion expenses, such as feature price discounts, in-store display incentives, cooperative advertising programs, new product introduction fees and coupon redemption costs. These forms of variable consideration are recognized upon sale. The recognition of costs for promotion programs involves the use of judgment related to performance and redemption estimates. Estimates are made based on historical experience and other factors, including expected volume. Historically, the difference between actual experience compared to estimated redemptions and performance has not been significant to the quarterly or annual financial statements. Differences between estimates and actual costs are recognized as a change in estimate in a subsequent period. Revenues are presented on a net basis for arrangements under which suppliers perform certain additional services. See Note 6 for additional information on disaggregation of revenue. In 2019, we adopted revised guidance on the recognition of revenue from contracts with customers. See Note 2 for additional information.
Cash and Cash Equivalents — All highly liquid debt instruments purchased with a maturity of three months or less are classified as cash equivalents.
Inventories — All inventories are valued at the lower of average cost or net realizable value.
Property, Plant and Equipment — Property, plant and equipment are recorded at historical cost and are depreciated over estimated useful lives using the straight-line method. Buildings and machinery and equipment are depreciated over periods not exceeding 45 years and 20 years, respectively. Assets are evaluated for impairment when conditions indicate that the carrying value may not be recoverable. Such conditions include signif
Free historical financial statements for Campbell Soup Co.. See how revenue, income, cash flow, and balance sheet financials have changed over 67 quarters since 2009. Compare with CPB stock chart to see long term trends.
Data imported from Campbell Soup Co. SEC filings. Check original filings before making any investment decision.