Health Care › Services-Commercial Physical And Biological Research

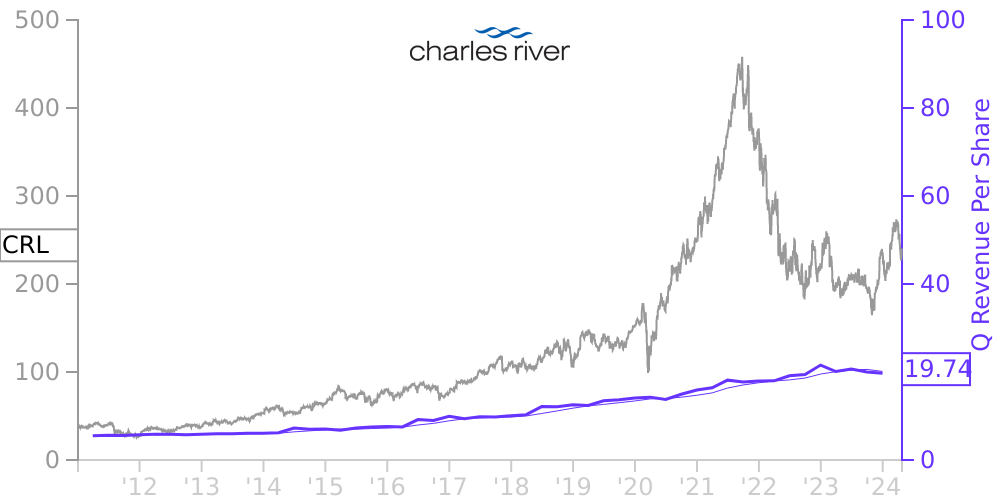
CRL Stock Price Correlated With Charles River Laboratories International Financials
External Links ⌄
Income Statement
Cash Flow
Balance Sheet
CRL Income Statement
Enable JavaScript and reload
Revenue, Net:
Cost of Goods & Services Sold:
Gross Profit:
Selling, General & Admin Expense:
Research & Development Expense:
Total Operating Expenses:
Operating Income:
Income Taxes:
Net Income:
CRL Cash Flow
Enable JavaScript and reload
Operating Activities Net Income:
Depreciation, Depletion & Amortization:
Change in Accounts Receiveable:
Net Cash from Operations:
Repurchases/Buybacks Common Stock:
Issuance of Long-term Debt:
Cash Dividends Paid:
Net Cash from Financing Activities:
Property, Plant & Equipment Purchases:
Purchases of Businesses, Net of Cash:
Net Cash from Investing Activities:
Net Change in Cash & Equivalents:
CRL Balance Sheet
Enable JavaScript and reload
Cash and Cash Equivalents:
Short-Term Investments:
Accounts Receivable, Net:
Inventories:
Total Current Assets:
Property, Plant & Equipment, Net:
Total Assets:
Accounts Payable:
Current Portion of Long-Term Debt:
Total Short-Term Liabilities:
Long Term Debt, Non-Current Portion:
Total Long-Term Liabilities:
Total Liabilities:
COMPANY PROFILE
BASIS OF PRESENTATION The accompanying condensed consolidated financial statements are unaudited and have been prepared by Charles River Laboratories International, Inc. (the Company) in accordance with accounting principles generally accepted in the United States (U.S. GAAP) and pursuant to the rules and regulations of the Securities and Exchange Commission (SEC). The year-end condensed consolidated balance sheet data was derived from the Company’s audited consolidated financial statements, but does not include all disclosures required by U.S. GAAP. These unaudited condensed consolidated financial statements should be read in conjunction with the Company’s Annual Report on Form 10-K for fiscal year 2021. The unaudited condensed consolidated financial statements, in the opinion of management, reflect all normal and recurring adjustments necessary for a fair statement of the Company’s financial position and results of operations.
Use of Estimates
The preparation of unaudited condensed consolidated financial statements in accordance with U.S. GAAP requires that the Company make estimates and judgments that may affect the reported amounts of assets, liabilities, revenues, expenses and related disclosure of contingent assets and liabilities. On an on-going basis, the Company evaluates its estimates, judgments, and methodologies. The Company bases its estimates on historical experience and on various other assumptions that are believed to be reasonable, the results of which form the basis for making judgments about the carrying values of assets and liabilities. Actual results may differ from these estimates under different assumptions or conditions. Changes in estimates are reflected in reported results in the period in which they become known.
Newly Issued Accounting Pronouncements
In November 2021, the FASB issued ASU 2021-10, “Government Assistance (Topic 832): Disclosures by Business Entities About Government Assistance.” ASU 2021-10 requires disclosures about transactions with a government that have been accounted for by a grant or contribution accounting model to increase transparency about the types of transactions, the accounting for the transactions, and the effect on the financial statements. The ASU is an annual disclosure effective for fiscal years beginning after December 15, 2021 and will be applied on a prospective basis. The Company is currently evaluating the impact this new standard will have on the consolidated financial statements and related disclosures, but does not believe there will be a material impact.
Summary of Significant Accounting Policies
The Company’s significant accounting policies are described in Note 1, “Description of Business and Summary of Significant Accounting Policies” in the Company’s Annual Report on Form 10-K for fiscal year 2021.
Consolidation
The Company’s unaudited condensed consolidated financial statements reflect its financial statements and those of its subsidiaries in which the Company holds a controlling financial interest. For consolidated entities in which the Company owns or is exposed to less than 100% of the economics, the Company records net income (loss) attributable to noncontrolling interests in its consolidated statements of income equal to the percentage of the economic or ownership interest retained in such entities by the respective noncontrolling parties. Intercompany balances and transactions are eliminated in consolidation.
The Company’s fiscal year is typically based on 52-weeks, with each quarter composed of 13 weeks ending on the last Saturday on, or closest to, March 31, June 30, September 30, and December 31. A 53rd week in the fourth quarter of the fiscal year is occasionally necessary to align with a December 31 calendar year-end, which will occur in this fiscal year 2022.
Segment Reporting
The Company reports its results in three reportable segments: Research Models and Services (RMS), Discovery and Safety Assessment (DSA), and Manufacturing S
Free historical financial statements for Charles River Laboratories International Inc.. See how revenue, income, cash flow, and balance sheet financials have changed over 61 quarters since 2011. Compare with CRL stock chart to see long term trends.
Data imported from Charles River Laboratories International Inc. SEC filings. Check original filings before making any investment decision.