Health Care › Biological Products (No Diagnostic Substances)

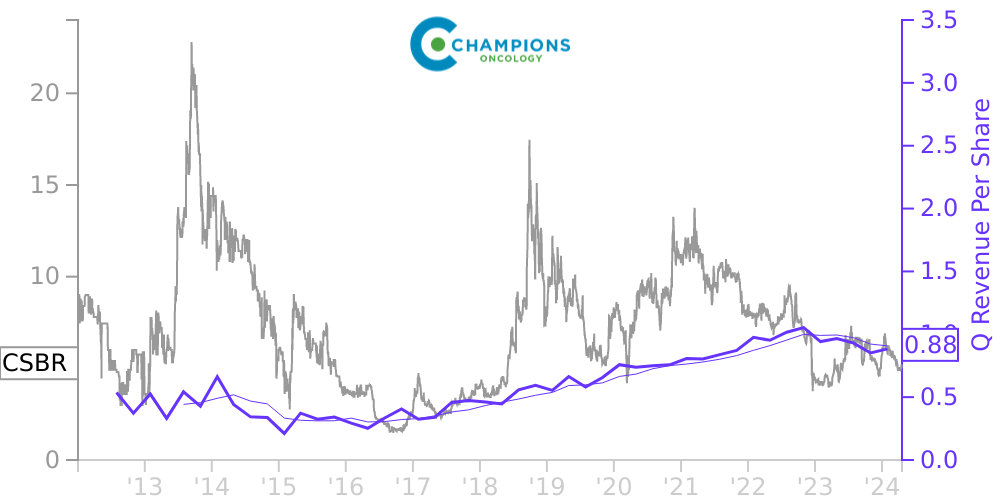
CSBR Stock Price Correlated With Champions Oncology Financials
External Links ⌄
Income Statement
Cash Flow
Balance Sheet
CSBR Income Statement
Enable JavaScript and reload
Revenue, Net:
Cost of Goods & Services Sold:
Gross Profit:
Selling, General & Admin Expense:
Research & Development Expense:
Total Operating Expenses:
Operating Income:
Income Taxes:
Net Income:
CSBR Cash Flow
Enable JavaScript and reload
Operating Activities Net Income:
Depreciation, Depletion & Amortization:
Change in Accounts Receiveable:
Net Cash from Operations:
Repurchases/Buybacks Common Stock:
Issuance of Long-term Debt:
Cash Dividends Paid:
Net Cash from Financing Activities:
Property, Plant & Equipment Purchases:
Purchases of Businesses, Net of Cash:
Net Cash from Investing Activities:
Net Change in Cash & Equivalents:
CSBR Balance Sheet
Enable JavaScript and reload
Cash and Cash Equivalents:
Short-Term Investments:
Accounts Receivable, Net:
Inventories:
Total Current Assets:
Property, Plant & Equipment, Net:
Total Assets:
Accounts Payable:
Current Portion of Long-Term Debt:
Total Short-Term Liabilities:
Long Term Debt, Non-Current Portion:
Total Long-Term Liabilities:
Total Liabilities:
COMPANY PROFILE
Organization and Basis of Presentation
Background
Champions Oncology, Inc. (the “Company”), is engaged in the development and sale of advanced technology solutions and products to personalize the development and use of oncology drugs. The Company’s TumorGraft Technology Platform is a novel approach to personalizing cancer care based upon the implantation of human tumors in immune-deficient mice. The Company uses this technology, in conjunction with related services, to offer solutions for two consumer groups: Personalized Oncology Solutions (“POS”) and Translational Oncology Solutions (“TOS”). POS assists physicians in developing personalized treatment options for their cancer patients through tumor specific data obtained from drug panels and related personalized oncology services. The Company’s TOS business offers a technology platform to pharmaceutical and biotechnology companies using proprietary TumorGraft studies, which the Company believes may be predictive of how drugs may perform in clinical settings.
The Company has two operating subsidiaries: Champions Oncology (Israel), Limited and Champions Biotechnology U.K., Limited. For the years ended April 30, 2017 and 2016 , there were no material revenues earned by these subsidiaries.
Basis of Presentation
The accompanying consolidated financial statements have been prepared in accordance with accounting principles generally accepted in the United States of America (“GAAP”).
Reverse Stock Split
On October 15, 2013, the shareholders of the Company authorized our Board of Directors to effect a reverse stock split of all outstanding shares of common stock, warrants and options. The Board of Directors subsequently approved the implementation of a reverse stock split at a ratio of one-for-twelve shares, which became effective on August 12, 2015. All share and per share data in these consolidated financial statements and related notes hereto have been retroactively adjusted to account for the effect of the reverse stock split.
Liquidity
Our liquidity needs have typically arisen from the funding of our research and development programs and the launch of new products, working capital requirements, and other strategic initiatives. In the past, we have met these cash requirements through our cash and cash equivalents, working capital management, proceeds from certain private placements and public offerings of our securities and sales of products and services. For the years ended April 30, 2017 and 2016, the Company had a net loss of approximately $6.9 million and $10.4 million , respectively. As of April 30, 2017, the Company had an accumulated deficit of approximately $69.3 million , negative working capital of $1.6 million and cash and cash equivalents of $3.3 million . We believe that our cash and cash equivalents on hand are adequate to fund operations through at least August 2018. Should the Company be required to raise additional capital, there can be no assurance that management would be successful in raising such capital on terms acceptable to us, if at all.
Free historical financial statements for Champions Oncology Inc. See how revenue, income, cash flow, and balance sheet financials have changed over 56 quarters since 2012. Compare with CSBR stock chart to see long term trends.
Data imported from Champions Oncology Inc SEC filings. Check original filings before making any investment decision.