Consumer Staples › Agriculture Services

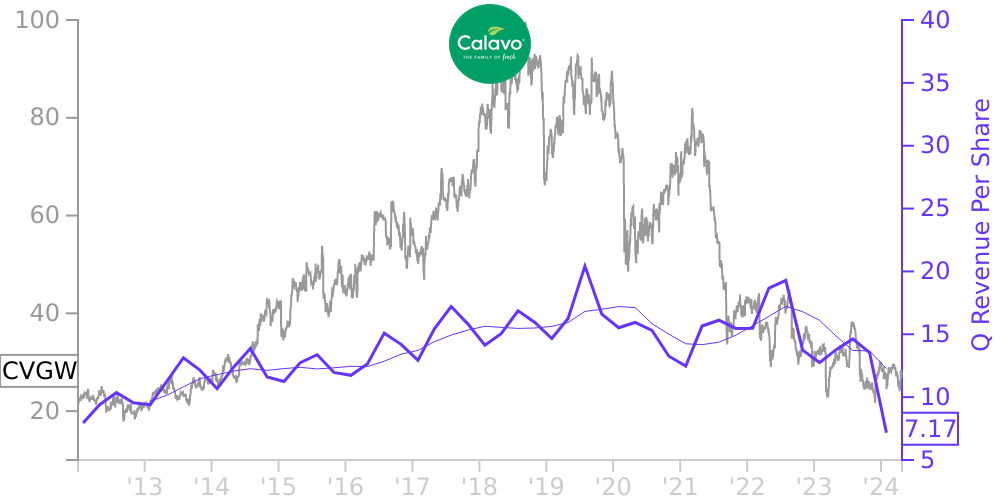
CVGW Stock Price Correlated With Calavo Growers Financials
External Links ⌄
Income Statement
Cash Flow
Balance Sheet
CVGW Income Statement
Enable JavaScript and reload
Revenue, Net:
Cost of Goods & Services Sold:
Gross Profit:
Selling, General & Admin Expense:
Research & Development Expense:
Total Operating Expenses:
Operating Income:
Income Taxes:
Net Income:
CVGW Cash Flow
Enable JavaScript and reload
Operating Activities Net Income:
Depreciation, Depletion & Amortization:
Change in Accounts Receiveable:
Net Cash from Operations:
Repurchases/Buybacks Common Stock:
Issuance of Long-term Debt:
Cash Dividends Paid:
Net Cash from Financing Activities:
Property, Plant & Equipment Purchases:
Purchases of Businesses, Net of Cash:
Net Cash from Investing Activities:
Net Change in Cash & Equivalents:
CVGW Balance Sheet
Enable JavaScript and reload
Cash and Cash Equivalents:
Short-Term Investments:
Accounts Receivable, Net:
Inventories:
Total Current Assets:
Property, Plant & Equipment, Net:
Total Assets:
Accounts Payable:
Current Portion of Long-Term Debt:
Total Short-Term Liabilities:
Long Term Debt, Non-Current Portion:
Total Long-Term Liabilities:
Total Liabilities:
COMPANY PROFILE
1. Description of the business Business Calavo Growers, Inc. (Calavo, the Company, we, us or our), is a global leader in the avocado industry and a provider of value-added fresh food. Our expertise in marketing and distributing avocados, prepared avocados, and other perishable foods allows us to deliver a wide array of fresh and prepared food products to retail grocery, foodservice, club stores, mass merchandisers, food distributors and wholesalers on a worldwide basis. We procure avocados from California, Mexico and other growing regions around the world. Through our various operating facilities, we (i) sort, pack, and/or ripen avocados, tomatoes and/or Hawaiian grown papayas, (ii) create, process and package a portfolio of healthy fresh foods including fresh-cut fruit and vegetables, and prepared foods and (iii) process and package guacamole and salsa. We distribute our products both domestically and internationally and report our operations in three different business segments: Fresh products, Renaissance Food Group (RFG) and Calavo Foods.
Free historical financial statements for Calavo Growers Inc. See how revenue, income, cash flow, and balance sheet financials have changed over 57 quarters since 2012. Compare with CVGW stock chart to see long term trends.
Data imported from Calavo Growers Inc SEC filings. Check original filings before making any investment decision.