Consumer Staples › Fats And Oils

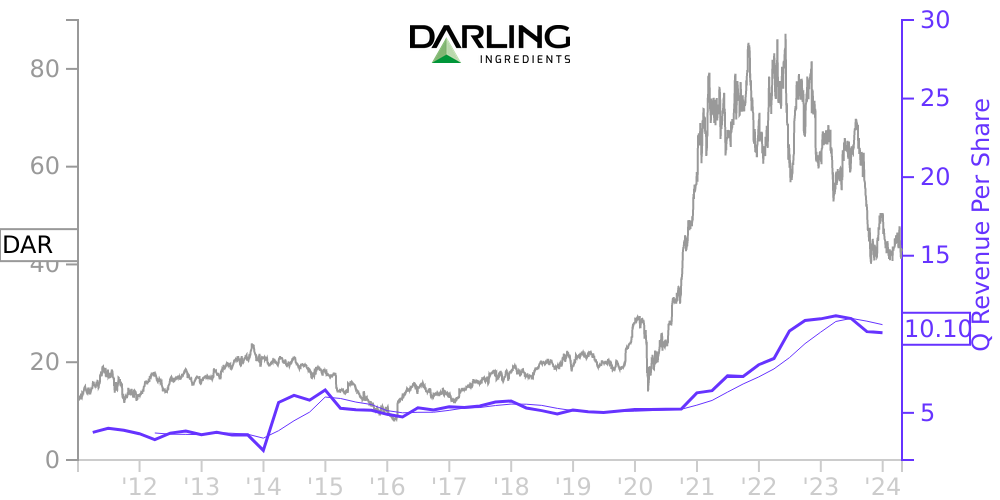
DAR Stock Price Correlated With Darling Ingredients Financials
External Links ⌄
Income Statement
Cash Flow
Balance Sheet
DAR Income Statement
Enable JavaScript and reload
Revenue, Net:
Cost of Goods & Services Sold:
Gross Profit:
Selling, General & Admin Expense:
Research & Development Expense:
Total Operating Expenses:
Operating Income:
Income Taxes:
Net Income:
DAR Cash Flow
Enable JavaScript and reload
Operating Activities Net Income:
Depreciation, Depletion & Amortization:
Change in Accounts Receiveable:
Net Cash from Operations:
Repurchases/Buybacks Common Stock:
Issuance of Long-term Debt:
Cash Dividends Paid:
Net Cash from Financing Activities:
Property, Plant & Equipment Purchases:
Purchases of Businesses, Net of Cash:
Net Cash from Investing Activities:
Net Change in Cash & Equivalents:
DAR Balance Sheet
Enable JavaScript and reload
Cash and Cash Equivalents:
Short-Term Investments:
Accounts Receivable, Net:
Inventories:
Total Current Assets:
Property, Plant & Equipment, Net:
Total Assets:
Accounts Payable:
Current Portion of Long-Term Debt:
Total Short-Term Liabilities:
Long Term Debt, Non-Current Portion:
Total Long-Term Liabilities:
Total Liabilities:
COMPANY PROFILE
GeneralThe accompanying consolidated financial statements for the three month periods ended April 2, 2022 and April 3, 2021, have been prepared by Darling Ingredients Inc., a Delaware corporation (“Darling”, and together with its subsidiaries, the “Company” or “we”, “us” or “our”) in accordance with generally accepted accounting principles in the United States (“GAAP”) without audit, pursuant to the rules and regulations of the Securities and Exchange Commission (“SEC”). The information furnished herein reflects all adjustments (consisting only of normal recurring accruals) that are, in the opinion of management, necessary to present a fair statement of the financial position and operating results of the Company as of and for the respective periods. However, these operating results are not necessarily indicative of the results expected for a full fiscal year. Certain information and footnote disclosures normally included in annual financial statements prepared in accordance with GAAP have been omitted pursuant to such rules and regulations. However, management of the Company believes, to the best of their knowledge, that the disclosures herein are adequate to make the information presented not misleading. The accompanying consolidated financial statements should be read in conjunction with the audited consolidated financial statements contained in the Company’s Form 10-K for the fiscal year ended January 1, 2022.
Free historical financial statements for Darling Ingredients Inc. See how revenue, income, cash flow, and balance sheet financials have changed over 61 quarters since 2011. Compare with DAR stock chart to see long term trends.
Data imported from Darling Ingredients Inc SEC filings. Check original filings before making any investment decision.