Consumer Staples › Retail-Variety Stores

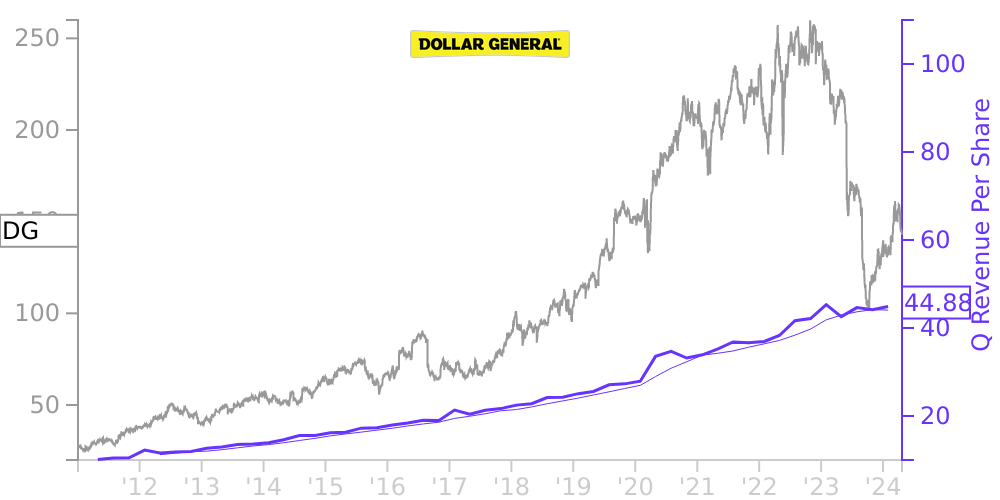
DG Stock Price Correlated With Dollar General Financials
External Links ⌄
Income Statement
Cash Flow
Balance Sheet
DG Income Statement
Enable JavaScript and reload
Revenue, Net:
Cost of Goods & Services Sold:
Gross Profit:
Selling, General & Admin Expense:
Research & Development Expense:
Total Operating Expenses:
Operating Income:
Income Taxes:
Net Income:
DG Cash Flow
Enable JavaScript and reload
Operating Activities Net Income:
Depreciation, Depletion & Amortization:
Change in Accounts Receiveable:
Net Cash from Operations:
Repurchases/Buybacks Common Stock:
Issuance of Long-term Debt:
Cash Dividends Paid:
Net Cash from Financing Activities:
Property, Plant & Equipment Purchases:
Purchases of Businesses, Net of Cash:
Net Cash from Investing Activities:
Net Change in Cash & Equivalents:
DG Balance Sheet
Enable JavaScript and reload
Cash and Cash Equivalents:
Short-Term Investments:
Accounts Receivable, Net:
Inventories:
Total Current Assets:
Property, Plant & Equipment, Net:
Total Assets:
Accounts Payable:
Current Portion of Long-Term Debt:
Total Short-Term Liabilities:
Long Term Debt, Non-Current Portion:
Total Long-Term Liabilities:
Total Liabilities:
COMPANY PROFILE
1. Basis of presentation and accounting policies Basis of presentation These notes contain references to the years 2021, 2020, and 2019, which represent fiscal years ended January 28, 2022, January 29, 2021, and January 31, 2020, respectively. The Company’s 2021, 2020 and 2019 accounting periods were each comprised of 52 weeks. The Company’s fiscal year ends on the Friday closest to January 31. The consolidated financial statements include all subsidiaries of the Company, except for its not-for-profit subsidiary which the Company does not control. Intercompany transactions have been eliminated. The Company sells general merchandise on a retail basis through 18,130 stores (as of January 28, 2022) in 46 states with the greatest concentration of stores in the southern, southwestern, midwestern and eastern United States. As of January 28, 2022, the Company operated 16 distribution centers for non-refrigerated products, ten cold storage distribution centers, and two combination distribution centers which have both refrigerated and non-refrigerated products. The Company leases 12 of these facilities and the remainder are owned. Cash and cash equivalents Cash and cash equivalents include highly liquid investments with insignificant interest rate risk and original maturities of three months or less when purchased. Such investments primarily consist of money market funds, bank deposits, certificates of deposit, and commercial paper. The carrying amounts of these items are a reasonable estimate of their fair value due to the short maturity of these investments. Payments due from processors for electronic tender transactions classified as cash and cash equivalents totaled approximately $133.9 million and $125.3 million at January 28, 2022 and January 29, 2021, respectively. Investments in debt and equity securities The Company accounts for investments in debt and marketable equity securities as held-to-maturity, available-for-sale, or trading, depending on their classification. Debt securities categorized as held-to-maturity are stated at amortized cost. Debt and equity securities categorized as available-for-sale are stated at fair value, with any unrealized gains and losses, net of deferred income taxes, reported as a component of Accumulated other comprehensive loss. Trading securities are stated at fair value, with changes in fair value recorded as a component of Selling, general and administrative (“SG&A”) expense. The cost of securities sold is based upon the specific identification method. Merchandise inventories Inventories are stated at the lower of cost or market (“LCM”) with cost determined using the retail last-in, first-out (“LIFO”) method as this method results in a better matching of costs and revenues. Under the Company’s retail inventory method (“RIM”), the calculation of gross profit and the resulting valuation of inventories at cost are computed by applying a calculated cost-to-retail inventory ratio to the retail value of sales at a department level. The use of the RIM will result in valuing inventories at LCM if markdowns are currently taken as a reduction of the retail value of inventories. Costs directly associated with warehousing and distribution are capitalized into inventory. The excess of current cost over LIFO cost was approximately $296.3 million and $115.9 million at January 28, 2022 and January 29, 2021, respectively. Current cost is determined using the RIM on a first-in, first-out basis. Under the LIFO inventory method, the impacts of rising or falling market price changes increase or decrease cost of sales (the LIFO provision or benefit). The Company recorded a LIFO provision of $180.4 million in 2021, $5.1 million in 2020, and $7.0 million in 2019, which is included in cost of goods sold in the consolidated statements of income. The Company purchases its merchandise from a wide variety of suppliers. The Company’s two largest suppliers accounted for approximately 9% and 8%, respe
Free historical financial statements for Dollar General Corp. See how revenue, income, cash flow, and balance sheet financials have changed over 61 quarters since 2011. Compare with DG stock chart to see long term trends.
Data imported from Dollar General Corp SEC filings. Check original filings before making any investment decision.