Communication › Services-Business Services, Nec

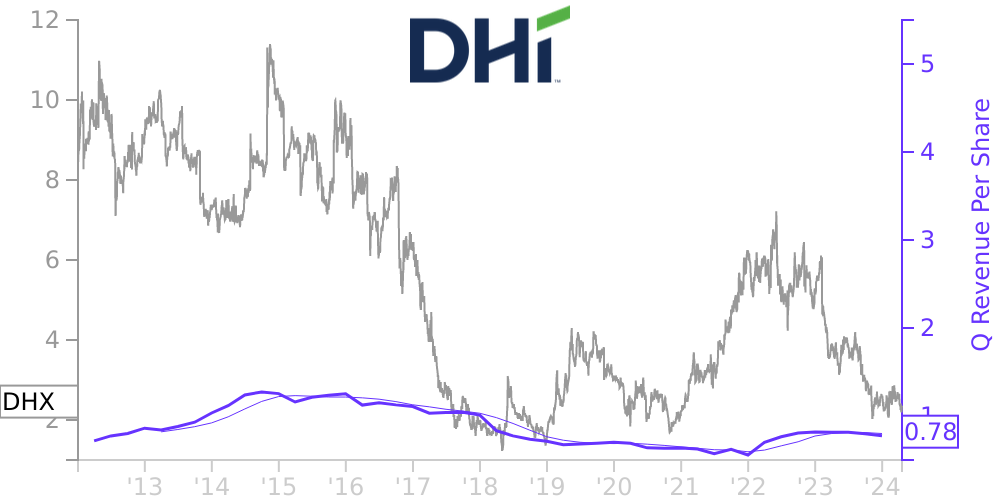
DHX Stock Price Correlated With DHI Financials
External Links ⌄
Income Statement
Cash Flow
Balance Sheet
DHX Income Statement
Enable JavaScript and reload
Revenue, Net:
Cost of Goods & Services Sold:
Gross Profit:
Selling, General & Admin Expense:
Research & Development Expense:
Total Operating Expenses:
Operating Income:
Income Taxes:
Net Income:
DHX Cash Flow
Enable JavaScript and reload
Operating Activities Net Income:
Depreciation, Depletion & Amortization:
Change in Accounts Receiveable:
Net Cash from Operations:
Repurchases/Buybacks Common Stock:
Issuance of Long-term Debt:
Cash Dividends Paid:
Net Cash from Financing Activities:
Property, Plant & Equipment Purchases:
Purchases of Businesses, Net of Cash:
Net Cash from Investing Activities:
Net Change in Cash & Equivalents:
DHX Balance Sheet
Enable JavaScript and reload
Cash and Cash Equivalents:
Short-Term Investments:
Accounts Receivable, Net:
Inventories:
Total Current Assets:
Property, Plant & Equipment, Net:
Total Assets:
Accounts Payable:
Current Portion of Long-Term Debt:
Total Short-Term Liabilities:
Long Term Debt, Non-Current Portion:
Total Long-Term Liabilities:
Total Liabilities:
COMPANY PROFILE
ORGANIZATION AND PRINCIPAL ACTIVITIES DHI Group, Inc. (“DHI” or the “Company”), a Delaware corporation, was incorporated on June 28, 2005. DHI is a leading provider of data, insights and employment connections through its specialized services for technology professionals and other select online communities. Its mission is to empower tech professionals and organizations to compete and win through expert insights and relevant employment connections. Employers and recruiters use its websites and services to source, hire and connect with the most qualified and highly-skilled tech professionals, while professionals use its websites and services to find ideal employment opportunities, relevant job advice and tailored career-related data. For over 30 years, through its predecessor companies, the Company was built on providing employers and professionals with career connections, news, tools and information.
On June 30, 2021, the Company transferred majority ownership and control of its eFinancialCareers ("eFC") business to eFC's management, while retaining a 40% common share interest. The eFC business was significant to the Company and the transfer was considered to be a strategic shift from the financial services industry and from the geographies eFC serves that had a major effect on the Company's operations. As a result, the eFC business was deconsolidated from the Company's consolidated financial statements as of June 30, 2021 and is reflected as a discontinued operation in the Consolidated Balance Sheets and the Consolidated Statements of Operations for all periods presented. The historical Consolidated Statements of Comprehensive Income (Loss), Stockholders’ Equity and Cash Flows have not been revised to reflect the effects of the transfer of control of eFC. For further information on discontinued operations, see Note 4, “Discontinued Operations.” Unless noted otherwise, discussion in the notes to the consolidated financial statements pertain to continuing operations .
The Company allocates resources and assesses financial performance on a consolidated basis, as all services pertain to the Company's Tech-focused strategy. As a result, t he Company has a single reportable segment, Tech-focused, which now includes only the Dice and ClearanceJobs brands, as well as corporate related costs. All operations are in the United States and the Company no longer has revenues and long-lived assets, which includes fixed assets and lease right of use assets, outside of the United States.
Free historical financial statements for DHI Group Inc. See how revenue, income, cash flow, and balance sheet financials have changed over 57 quarters since 2012. Compare with DHX stock chart to see long term trends.
Data imported from DHI Group Inc SEC filings. Check original filings before making any investment decision.