Health Care › Services-Misc Health And Allied Services, Nec

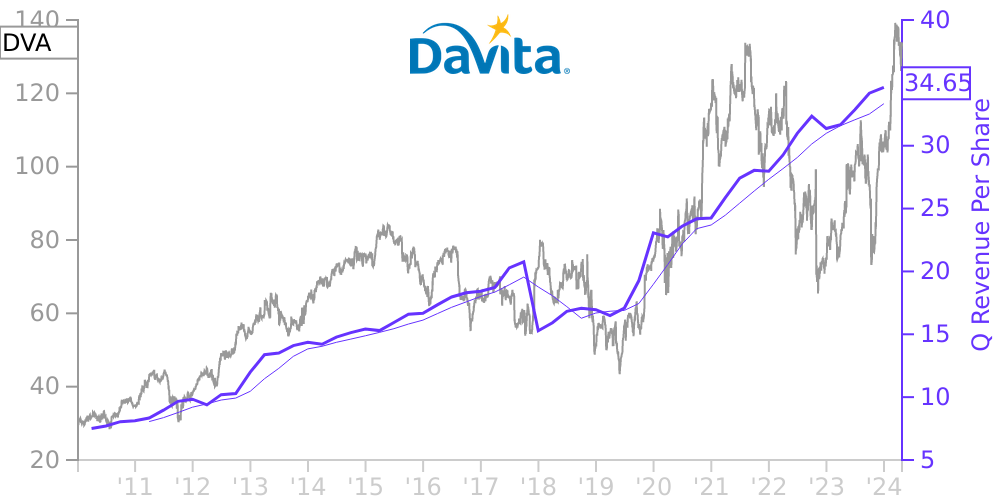
DVA Stock Price Correlated With DaVita Financials
External Links ⌄
Income Statement
Cash Flow
Balance Sheet
DVA Income Statement
Enable JavaScript and reload
Revenue, Net:
Cost of Goods & Services Sold:
Gross Profit:
Selling, General & Admin Expense:
Research & Development Expense:
Total Operating Expenses:
Operating Income:
Income Taxes:
Net Income:
DVA Cash Flow
Enable JavaScript and reload
Operating Activities Net Income:
Depreciation, Depletion & Amortization:
Change in Accounts Receiveable:
Net Cash from Operations:
Repurchases/Buybacks Common Stock:
Issuance of Long-term Debt:
Cash Dividends Paid:
Net Cash from Financing Activities:
Property, Plant & Equipment Purchases:
Purchases of Businesses, Net of Cash:
Net Cash from Investing Activities:
Net Change in Cash & Equivalents:
DVA Balance Sheet
Enable JavaScript and reload
Cash and Cash Equivalents:
Short-Term Investments:
Accounts Receivable, Net:
Inventories:
Total Current Assets:
Property, Plant & Equipment, Net:
Total Assets:
Accounts Payable:
Current Portion of Long-Term Debt:
Total Short-Term Liabilities:
Long Term Debt, Non-Current Portion:
Total Long-Term Liabilities:
Total Liabilities:
COMPANY PROFILE
Condensed consolidated interim financial statementsThe unaudited condensed consolidated interim financial statements included in this report are prepared by the Company. In the opinion of management, all adjustments necessary for a fair presentation of the results of operations are reflected in these condensed consolidated interim financial statements. All significant intercompany accounts and transactions have been eliminated. The preparation of these financial statements requires management to make estimates and assumptions that affect the reported amounts of revenues, expenses, assets, liabilities, contingencies and noncontrolling interests subject to put provisions. The most significant estimates and assumptions underlying these financial statements and accompanying notes generally involve revenue recognition and accounts receivable, certain fair value estimates, accounting for income taxes and loss contingencies. The results of operations reflected in these interim financial statements may not necessarily be indicative of annual operating results. These condensed consolidated interim financial statements should be read in conjunction with the audited consolidated financial statements and notes thereto included in the Company’s Annual Report on Form 10-K for the year ended December 31, 2021 (2021 10-K). Prior period classifications conform to the current period presentation. The Company has evaluated subsequent events through the date these condensed consolidated interim financial statements were issued and has included all necessary adjustments and disclosures.
Free historical financial statements for DaVita Inc.. See how revenue, income, cash flow, and balance sheet financials have changed over 65 quarters since 2010. Compare with DVA stock chart to see long term trends.
Data imported from DaVita Inc. SEC filings. Check original filings before making any investment decision.