Health Care › Pharmaceutical Preparations

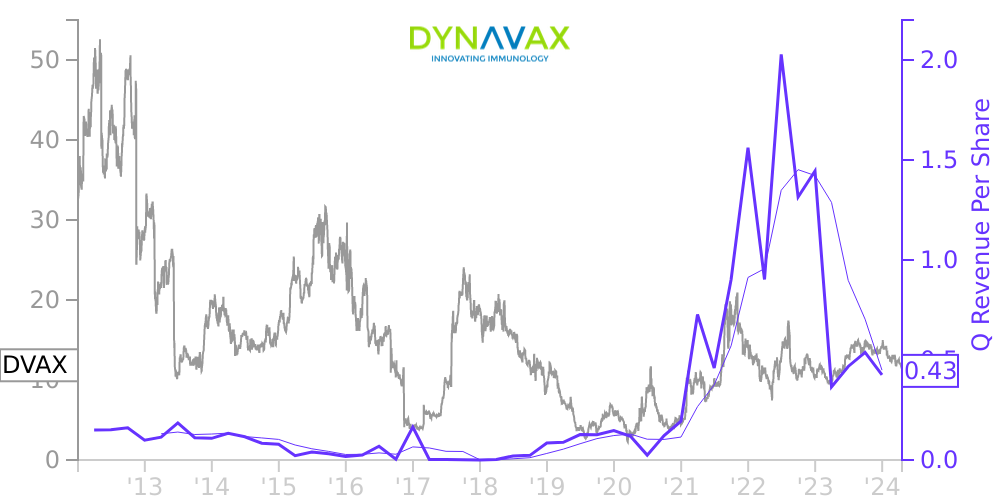
DVAX Stock Price Correlated With Dynavax Technologies Financials
External Links ⌄
Income Statement
Cash Flow
Balance Sheet
DVAX Income Statement
Enable JavaScript and reload
Revenue, Net:
Cost of Goods & Services Sold:
Gross Profit:
Selling, General & Admin Expense:
Research & Development Expense:
Total Operating Expenses:
Operating Income:
Income Taxes:
Net Income:
DVAX Cash Flow
Enable JavaScript and reload
Operating Activities Net Income:
Depreciation, Depletion & Amortization:
Change in Accounts Receiveable:
Net Cash from Operations:
Repurchases/Buybacks Common Stock:
Issuance of Long-term Debt:
Cash Dividends Paid:
Net Cash from Financing Activities:
Property, Plant & Equipment Purchases:
Purchases of Businesses, Net of Cash:
Net Cash from Investing Activities:
Net Change in Cash & Equivalents:
DVAX Balance Sheet
Enable JavaScript and reload
Cash and Cash Equivalents:
Short-Term Investments:
Accounts Receivable, Net:
Inventories:
Total Current Assets:
Property, Plant & Equipment, Net:
Total Assets:
Accounts Payable:
Current Portion of Long-Term Debt:
Total Short-Term Liabilities:
Long Term Debt, Non-Current Portion:
Total Long-Term Liabilities:
Total Liabilities:
COMPANY PROFILE
1. Organization
Dynavax Technologies Corporation (“we,” “our,” “us,” “Dynavax” or the “Company”), is a commercial stage biopharmaceutical company focused on developing and commercializing innovative vaccines. Our first marketed product, HEPLISAV-B® (Hepatitis B Vaccine (Recombinant), Adjuvanted) is approved in the United States and European Union for prevention of infection caused by all known subtypes of hepatitis B virus in adults age 18 years and older. We also manufacture and sell CpG 1018®, the adjuvant used in HEPLISAV-B. We are working to develop CpG 1018 as a premier vaccine adjuvant through research collaborations and partnerships. Current collaborations are focused on adjuvanted vaccines for COVID-19, plague, Tdap, seasonal influenza, universal influenza and shingles. We reincorporated in Delaware in 2000.
Dynavax Technologies Corporation (“we,” “our,” “us,” “Dynavax” or the “Company”), is a commercial stage biopharmaceutical company focused on developing and commercializing innovative vaccines. Our first marketed product, HEPLISAV-B® (Hepatitis B Vaccine (Recombinant), Adjuvanted) is approved in the United States and European Union for prevention of infection caused by all known subtypes of hepatitis B virus in adults age 18 years and older. We also manufacture and sell CpG 1018®, the adjuvant used in HEPLISAV-B. We are working to develop CpG 1018 as a premier vaccine adjuvant through research collaborations and partnerships. Current collaborations are focused on adjuvanted vaccines for COVID-19, plague, Tdap, seasonal influenza, universal influenza and shingles. We reincorporated in Delaware in 2000.
Free historical financial statements for Dynavax Technologies Corp. See how revenue, income, cash flow, and balance sheet financials have changed over 55 quarters since 2012. Compare with DVAX stock chart to see long term trends.
Data imported from Dynavax Technologies Corp SEC filings. Check original filings before making any investment decision.