
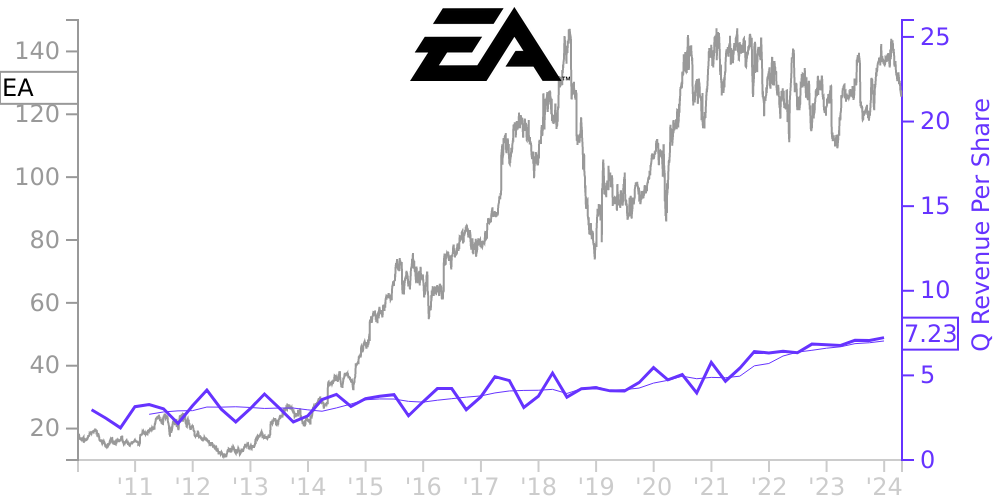
EA Stock Price Correlated With Electronic Arts Financials
External Links ⌄
Income Statement
Cash Flow
Balance Sheet
EA Income Statement
Enable JavaScript and reload
Revenue, Net:
Cost of Goods & Services Sold:
Gross Profit:
Selling, General & Admin Expense:
Research & Development Expense:
Total Operating Expenses:
Operating Income:
Income Taxes:
Net Income:
EA Cash Flow
Enable JavaScript and reload
Operating Activities Net Income:
Depreciation, Depletion & Amortization:
Change in Accounts Receiveable:
Net Cash from Operations:
Repurchases/Buybacks Common Stock:
Issuance of Long-term Debt:
Cash Dividends Paid:
Net Cash from Financing Activities:
Property, Plant & Equipment Purchases:
Purchases of Businesses, Net of Cash:
Net Cash from Investing Activities:
Net Change in Cash & Equivalents:
EA Balance Sheet
Enable JavaScript and reload
Cash and Cash Equivalents:
Short-Term Investments:
Accounts Receivable, Net:
Inventories:
Total Current Assets:
Property, Plant & Equipment, Net:
Total Assets:
Accounts Payable:
Current Portion of Long-Term Debt:
Total Short-Term Liabilities:
Long Term Debt, Non-Current Portion:
Total Long-Term Liabilities:
Total Liabilities:
COMPANY PROFILE
(1) DESCRIPTION OF BUSINESS AND BASIS OF PRESENTATION
Electronic Arts is a global leader in digital interactive entertainment. We develop, market, publish and deliver games, content and services that can be played and watched on game consoles, PCs, mobile phones and tablets. We believe that the breadth and depth of our portfolio, live services offerings, and our use of multiple business models and distribution channels provide us with strategic advantages. Our foundation is a collection of intellectual property from which we create innovative games and content that enables us to build on-going and meaningful relationships with a community of players, creators and viewers. Our portfolio includes brands that we either wholly own (such as Battlefield, The Sims, Apex Legends, Need for Speed and Plants vs. Zombies) or license from others (such as FIFA, Madden NFL, UFC, NHL, Formula 1 and Star Wars). Through our live services offerings, we offer our players high-quality experiences designed to provide value to players and extend and enhance gameplay. These live services include extra content, subscription offerings and other revenue generated outside of the sale of our base games. In addition, we are focused on reaching more players whenever and wherever they want to play. We believe that we can add value to our network by making it easier for players to connect to a world of play by offering choice of business model, distribution channel and device.
Consolidation
The accompanying Consolidated Financial Statements include the accounts of Electronic Arts Inc. and its wholly-owned subsidiaries. Intercompany balances and transactions have been eliminated in consolidation.
Fiscal Year
Our fiscal year is reported on a 52- or 53-week period that ends on the Saturday nearest March 31. Our results of operations for the fiscal year ended March 31, 2021 contained 53 weeks and ended on April 3, 2021. Our results of operations for the fiscal years ended March 31, 2020 and 2019 contained 52 weeks each and ended on March 28, 2020 and March 30, 2019, respectively. For simplicity of disclosure, all fiscal periods are referred to as ending on a calendar month end.
Use of Estimates
The preparation of consolidated financial statements in conformity with accounting principles generally accepted in the United States (“U.S. GAAP”) requires us to make estimates and assumptions that affect the amounts reported in our consolidated financial statements and the accompanying notes. Such estimates include offering periods for deferred net revenue, sales returns and allowances, provisions for doubtful accounts, accrued liabilities, relative stand-alone selling price for identified performance obligations in our revenue transactions, losses on royalty commitments, estimates regarding the recoverability of prepaid royalties, inventories, long-lived assets, discount rates used in the measurement and recognition of lease liabilities, assets acquired and liabilities assumed in business combinations, certain estimates related to the measurement and recognition of costs resulting from our stock-based payment awards, unrecognized tax benefits, deferred income tax assets and associated valuation allowances, as well as estimates used in our goodwill, intangibles and short-term investment impairment tests. These estimates generally involve complex issues and require us to make judgments, involve analysis of historical and future trends, can require extended periods of time to resolve, and are subject to change from period to period. In all cases, actual results could differ materially from our estimates.
Reclassifications
As our business has evolved and management focuses less on the differentiation between our packaged goods business and our digital business and more on our full game sales and live services that extend and enhance gameplay, we have updated our presentation of net revenue by composition to align with this management view. Certain prior year amount
Free historical financial statements for Electronic Arts Inc. See how revenue, income, cash flow, and balance sheet financials have changed over 68 quarters since 2009. Compare with EA stock chart to see long term trends.
Data imported from Electronic Arts Inc SEC filings. Check original filings before making any investment decision.