Communication › Services-Computer Programming, Data Processing, Etc.

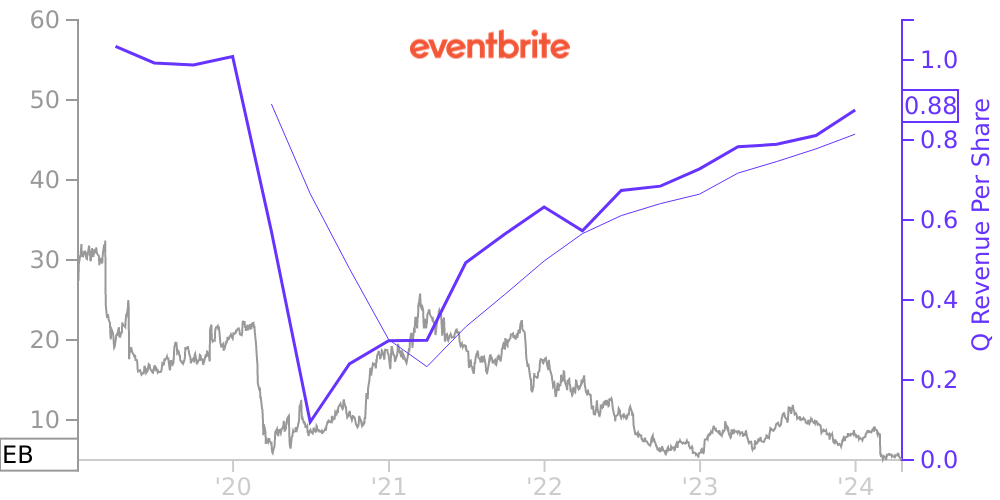
EB Stock Price Correlated With Eventbrite Financials
External Links ⌄
Income Statement
Cash Flow
Balance Sheet
EB Income Statement
Enable JavaScript and reload
Revenue, Net:
Cost of Goods & Services Sold:
Gross Profit:
Selling, General & Admin Expense:
Research & Development Expense:
Total Operating Expenses:
Operating Income:
Income Taxes:
Net Income:
EB Cash Flow
Enable JavaScript and reload
Operating Activities Net Income:
Depreciation, Depletion & Amortization:
Change in Accounts Receiveable:
Net Cash from Operations:
Repurchases/Buybacks Common Stock:
Issuance of Long-term Debt:
Cash Dividends Paid:
Net Cash from Financing Activities:
Property, Plant & Equipment Purchases:
Purchases of Businesses, Net of Cash:
Net Cash from Investing Activities:
Net Change in Cash & Equivalents:
EB Balance Sheet
Enable JavaScript and reload
Cash and Cash Equivalents:
Short-Term Investments:
Accounts Receivable, Net:
Inventories:
Total Current Assets:
Property, Plant & Equipment, Net:
Total Assets:
Accounts Payable:
Current Portion of Long-Term Debt:
Total Short-Term Liabilities:
Long Term Debt, Non-Current Portion:
Total Long-Term Liabilities:
Total Liabilities:
COMPANY PROFILE
Overview and Basis of Presentation Description of Business
Eventbrite, Inc. (Eventbrite or the Company) has built a powerful, broad technology platform to enable creators to solve the challenges associated with creating in-person and online live experiences. The Company’s platform integrates components needed to seamlessly plan, promote and produce live events. To further enhance the value of the creators’ self-service experience, the Company is working to reframe the Eventbrite product around the ongoing operational needs of creators in addition to the requirements of individual events. To this end, the Company has improved events calendaring, streamlined the event creation process and launched tools to assist creators in promoting multiple events and increasing audience size for their events.
Initial Public Offering
In September 2018, the Company completed its initial public offering (IPO) in which the Company issued and sold 11,500,000 shares of Class A common stock at a public offering price of $23.00 per share, which included 1,500,000 shares sold pursuant to the exercise by the underwriters' option to purchase additional shares. The Company received aggregate net proceeds of $246.0 million from the IPO, net of underwriter discounts and commissions, before deducting offering costs of $5.5 million, net of reimbursements.
Immediately prior to the closing of the IPO, (i) all shares of common stock then outstanding were reclassified as Class B Common Stock, (ii) 41,628,207 shares of redeemable convertible preferred stock outstanding converted into 42,188,624 shares of Class B common stock (including additional shares issued upon conversion of the Series G redeemable convertible preferred stock based on the IPO price of $23.00 per share) and (iii) warrants to purchase 933,269 shares of the Series G redeemable convertible preferred stock automatically exercised into 997,193 shares of Class B common stock.
Basis of Presentation
The consolidated financial statements have been prepared in accordance with accounting principles generally accepted in the United States of America (GAAP) and include the accounts of the Company and its wholly owned subsidiaries. All intercompany transactions and accounts have been eliminated. Certain prior period amounts have been reclassified to conform to the current period presentation.
Revision of Consolidated Financial Statements
In connection with the preparation of its financial statements for the year ended December 31, 2020, the Company identified an error within the Company’s consolidated statement of cash flows for the year ended December 31, 2019, which accompanying financial statements have been revised to correct for such error. The impact of such revision resulted in net cash provided by operating activities increasing by $1,297 to $29,955 and net cash used in financing activities increasing by $1,297 to $32,817 for the year ended December 31, 2019. The Company evaluated the error and concluded that it was not material to the 2019 financial statements previously issued. These revisions have no impact on our previously reported consolidated net income, financial position, net change in cash, cash equivalents, and restricted cash, or total cash, cash equivalents, and restricted cash as reported on the Company's consolidated statements of cash flows.
Use of Estimates
In order to conform with GAAP, the Company is required to make certain estimates, judgments and assumptions when preparing its consolidated financial statements. These estimates, judgments and assumptions affect the reported assets and liabilities and disclosure of contingent assets and liabilities at the date of the financial statements, as well as the reported amounts of revenue and expenses during the reported periods. These estimates include, but are not limited to, the recoverability of creator signing fees and creator advances, chargebacks and refunds reserve, certain assumptions used in the valuation of equity
Free historical financial statements for Eventbrite Inc. See how revenue, income, cash flow, and balance sheet financials have changed over 28 quarters since 2019. Compare with EB stock chart to see long term trends.
Data imported from Eventbrite Inc SEC filings. Check original filings before making any investment decision.