Consumer Staples › Perfumes, Cosmetics And Other Toilet Preparations

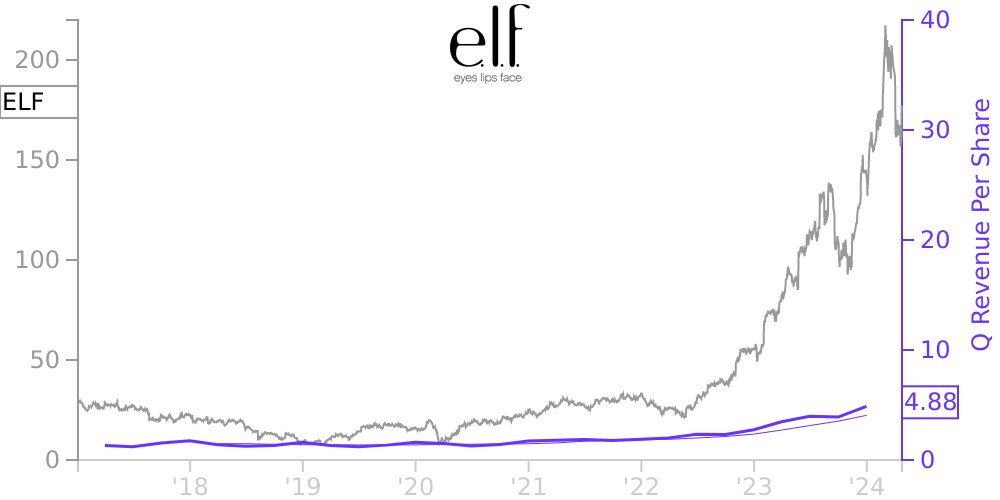
ELF Stock Price Correlated With elf Beauty Financials
External Links ⌄
Income Statement
Cash Flow
Balance Sheet
ELF Income Statement
Enable JavaScript and reload
Revenue, Net:
Cost of Goods & Services Sold:
Gross Profit:
Selling, General & Admin Expense:
Research & Development Expense:
Total Operating Expenses:
Operating Income:
Income Taxes:
Net Income:
ELF Cash Flow
Enable JavaScript and reload
Operating Activities Net Income:
Depreciation, Depletion & Amortization:
Change in Accounts Receiveable:
Net Cash from Operations:
Repurchases/Buybacks Common Stock:
Issuance of Long-term Debt:
Cash Dividends Paid:
Net Cash from Financing Activities:
Property, Plant & Equipment Purchases:
Purchases of Businesses, Net of Cash:
Net Cash from Investing Activities:
Net Change in Cash & Equivalents:
ELF Balance Sheet
Enable JavaScript and reload
Cash and Cash Equivalents:
Short-Term Investments:
Accounts Receivable, Net:
Inventories:
Total Current Assets:
Property, Plant & Equipment, Net:
Total Assets:
Accounts Payable:
Current Portion of Long-Term Debt:
Total Short-Term Liabilities:
Long Term Debt, Non-Current Portion:
Total Long-Term Liabilities:
Total Liabilities:
COMPANY PROFILE
Transition period The Company is presenting its consolidated financial statements for the three-month transition period ended March 31, 2019. The following tables provide certain unaudited comparative financial information for the same period of the prior year.
Consolidated Statements of Income
(in thousands, except share and per share data)
Three months ended March 31, (unaudited) 2019 2018 Net sales $ 66,141 $ 65,920 Cost of sales 25,650 25,712 Gross profit 40,491 40,208 Selling, general and administrative expenses 37,324 36,234 Restructuring expenses 22,176 — Operating income (loss) (19,009) 3,974 Other expense, net (315) (888) Interest expense, net (1,849) (1,963) Income (loss) before provision for income taxes (21,173) 1,123 Income tax benefit (provision) 3,259 (433) Net income (loss) $ (17,914) $ 690 Comprehensive income (loss) $ (17,914) $ 690 Net income (loss) per share: Basic $ (0.37) $ 0.01 Diluted $ (0.37) $ 0.01 Weighted average shares outstanding: Basic 48,022,926 46,435,560 Diluted 48,022,926 49,302,771
Consolidated Statements of Cash Flows
(in thousands)
Three months ended March 31, 2019 2018 Cash flows from operating activities: (unaudited) Net income (loss) $ (17,914) $ 690 Adjustments to reconcile net income (loss) to net cash provided by
operating activities:
Depreciation and amortization 7,544 4,288 Restructuring loss 22,176 — Stock-based compensation expense 3,683 3,640 Amortization of debt issuance costs and discount on debt 190 199 Deferred income taxes (3,433) 735 Other, net 242 142 Changes in operating assets and liabilities: Accounts receivable 4,215 12,771 Inventories 2,561 951 Prepaid expenses and other assets (1,732) (1,498) Accounts payable and accrued expenses (6,021) (16,891) Other liabilities (3,295) 3 Net cash provided by operating activities 8,216 5,030 Cash flows from investing activities: Purchase of property and equipment (3,400) (2,667) Net cash used in investing activities (3,400) (2,667) Cash flows from financing activities: Proceeds from revolving line of credit — 2,000 Repayment of revolving line of credit — (2,000) Repayment of long-term debt (2,063) (2,063) Cash received from issuance of common stock 115 212 Other, net (199) (97) Net cash used in financing activities (2,147) (1,948) Net increase in cash and cash equivalents 2,669 415 Cash and cash equivalents - beginning of period 51,205 10,059 Cash and cash equivalents - end of period $ 53,874 $ 10,474
Free historical financial statements for elf Beauty Inc.. See how revenue, income, cash flow, and balance sheet financials have changed over 37 quarters since 2017. Compare with ELF stock chart to see long term trends.
Data imported from elf Beauty Inc. SEC filings. Check original filings before making any investment decision.