Communication › Television Broadcasting Stations

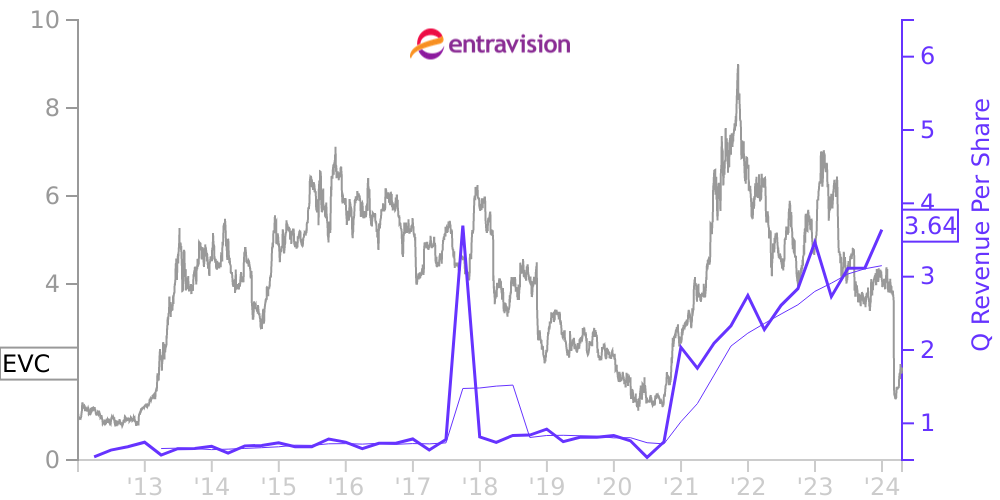
EVC Stock Price Correlated With Entravision Communications Corp Financials
External Links ⌄
Income Statement
Cash Flow
Balance Sheet
EVC Income Statement
Enable JavaScript and reload
Revenue, Net:
Cost of Goods & Services Sold:
Gross Profit:
Selling, General & Admin Expense:
Research & Development Expense:
Total Operating Expenses:
Operating Income:
Income Taxes:
Net Income:
EVC Cash Flow
Enable JavaScript and reload
Operating Activities Net Income:
Depreciation, Depletion & Amortization:
Change in Accounts Receiveable:
Net Cash from Operations:
Repurchases/Buybacks Common Stock:
Issuance of Long-term Debt:
Cash Dividends Paid:
Net Cash from Financing Activities:
Property, Plant & Equipment Purchases:
Purchases of Businesses, Net of Cash:
Net Cash from Investing Activities:
Net Change in Cash & Equivalents:
EVC Balance Sheet
Enable JavaScript and reload
Cash and Cash Equivalents:
Short-Term Investments:
Accounts Receivable, Net:
Inventories:
Total Current Assets:
Property, Plant & Equipment, Net:
Total Assets:
Accounts Payable:
Current Portion of Long-Term Debt:
Total Short-Term Liabilities:
Long Term Debt, Non-Current Portion:
Total Long-Term Liabilities:
Total Liabilities:
COMPANY PROFILE
1. BASIS OF PRESENTATION Presentation The consolidated financial statements included herein have been prepared by Entravision Communications Corporation (the “Company”), pursuant to the rules and regulations of the Securities and Exchange Commission (the “SEC”). Certain information and footnote disclosures normally included in financial statements prepared in accordance with accounting principles generally accepted in the United States of America (“GAAP”) have been omitted pursuant to such rules and regulations. These consolidated financial statements and notes thereto should be read in conjunction with the Company’s audited consolidated financial statements for the year ended December 31, 2021 included in the Company’s 2021 10-K for the year ended December 31, 2021. The unaudited information contained herein has been prepared on the same basis as the Company’s audited consolidated financial statements and, in the opinion of the Company’s management, includes all adjustments (consisting of only normal recurring adjustments) necessary for a fair presentation of the information for the periods presented. The interim results presented herein are not necessarily indicative of the results of operations that may be expected for the full fiscal year ending December 31, 2022 or any other future period.
Free historical financial statements for Entravision Communications Corp Cl. See how revenue, income, cash flow, and balance sheet financials have changed over 57 quarters since 2012. Compare with EVC stock chart to see long term trends.
Data imported from Entravision Communications Corp Cl SEC filings. Check original filings before making any investment decision.