Health Care › Orthopedic, Prosthetic And Surgical Appliances And Supplies

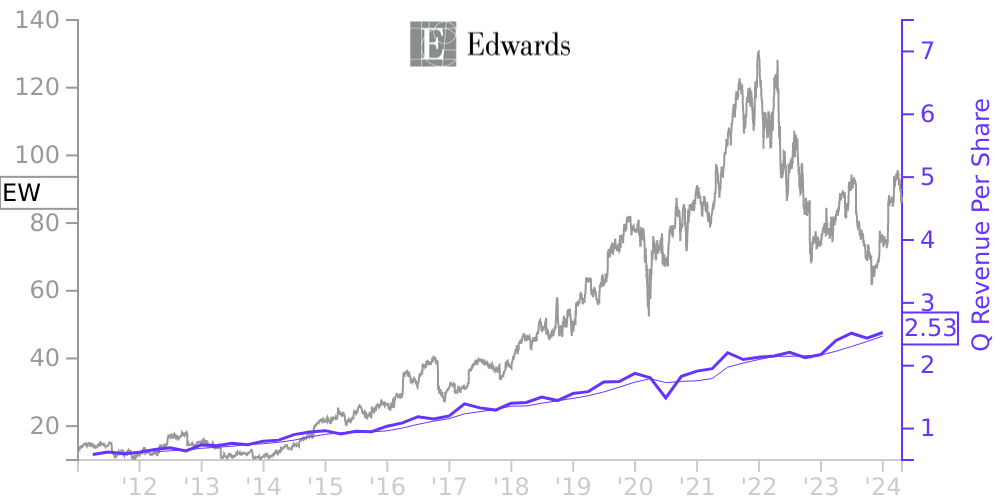
EW Stock Price Correlated With Edwards Lifesciences Financials
External Links ⌄
Income Statement
Cash Flow
Balance Sheet
EW Income Statement
Enable JavaScript and reload
Revenue, Net:
Cost of Goods & Services Sold:
Gross Profit:
Selling, General & Admin Expense:
Research & Development Expense:
Total Operating Expenses:
Operating Income:
Income Taxes:
Net Income:
EW Cash Flow
Enable JavaScript and reload
Operating Activities Net Income:
Depreciation, Depletion & Amortization:
Change in Accounts Receiveable:
Net Cash from Operations:
Repurchases/Buybacks Common Stock:
Issuance of Long-term Debt:
Cash Dividends Paid:
Net Cash from Financing Activities:
Property, Plant & Equipment Purchases:
Purchases of Businesses, Net of Cash:
Net Cash from Investing Activities:
Net Change in Cash & Equivalents:
EW Balance Sheet
Enable JavaScript and reload
Cash and Cash Equivalents:
Short-Term Investments:
Accounts Receivable, Net:
Inventories:
Total Current Assets:
Property, Plant & Equipment, Net:
Total Assets:
Accounts Payable:
Current Portion of Long-Term Debt:
Total Short-Term Liabilities:
Long Term Debt, Non-Current Portion:
Total Long-Term Liabilities:
Total Liabilities:
COMPANY PROFILE
BASIS OF PRESENTATION The accompanying interim consolidated condensed financial statements and related disclosures have been prepared pursuant to the rules and regulations of the Securities and Exchange Commission ("SEC") and should be read in conjunction with the consolidated financial statements and notes included in Edwards Lifesciences' Annual Report on Form 10-K for the year ended December 31, 2021. Certain information and footnote disclosures normally included in financial statements prepared in accordance with generally accepted accounting principles in the United States of America ("GAAP") have been condensed or omitted.
The preparation of financial statements in conformity with GAAP requires management to make estimates and assumptions that affect the amounts reported in the financial statements. Actual results could differ from those estimates. In particular, the COVID-19 pandemic has adversely impacted, and may further adversely impact, nearly all aspects of the Company's business and markets, including its workforce and the operations of its customers, suppliers, and business partners. The full extent to which the pandemic will directly or indirectly impact the Company's business, results of operations and financial condition, including sales, expenses, manufacturing, clinical trials, research and development costs, reserves and allowances, fair value measurements, asset impairment charges, contingent consideration obligations, and the effectiveness of the Company's hedging instruments, will depend on future developments that are highly uncertain and difficult to predict. These developments include, but are not limited to, the duration and spread of the outbreak (including new and more contagious
variants of COVID-19), its severity, the actions to contain the virus or address its impact, the timing, distribution, public acceptance and efficacy of vaccines and other treatments, and the associated impact on economic and operating conditions.
In the opinion of management, the interim consolidated condensed financial statements reflect all adjustments necessary for a fair statement of the results for the interim periods presented. All such adjustments are of a normal, recurring nature. The results of operations for the interim periods are not necessarily indicative of the results of operations to be expected for the full year.
There have been no material changes to the Company's significant accounting policies from those described in the Company's Annual Report on Form 10-K for the year ended December 31, 2021.
Recently Adopted Accounting Standards
In November 2021, the Financial Accounting Standards Board ("FASB") issued an amendment to the accounting
guidance on government assistance. The guidance requires certain disclosures about transactions with a government that are
accounted for by applying a grant or contribution model. The guidance was effective for annual periods beginning after December 15, 2021. The adoption of this guidance was applied prospectively and did not have a material impact on the Company's consolidated financial statements.
Free historical financial statements for Edwards Lifesciences Corp. See how revenue, income, cash flow, and balance sheet financials have changed over 61 quarters since 2011. Compare with EW stock chart to see long term trends.
Data imported from Edwards Lifesciences Corp SEC filings. Check original filings before making any investment decision.