Financials › Services-Computer Programming, Data Processing, Etc.

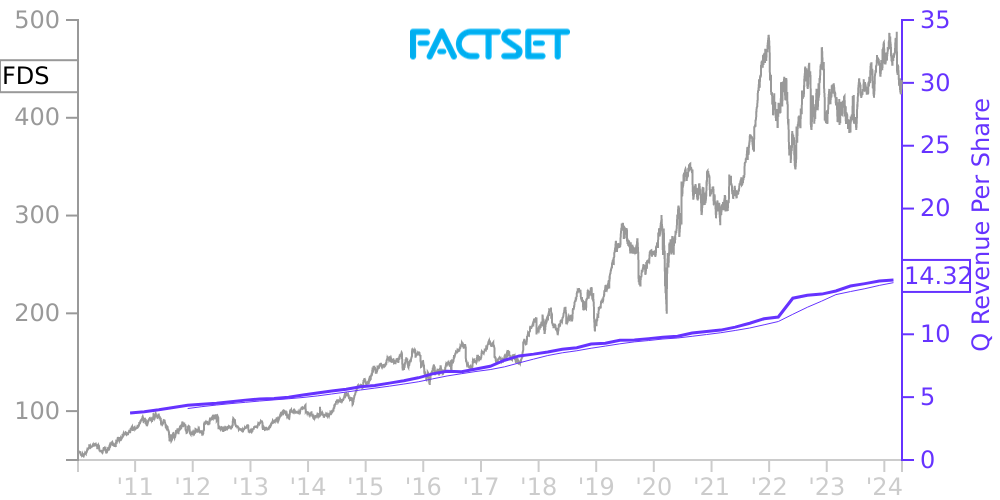
FDS Stock Price Correlated With FactSet Research Systems Financials
External Links ⌄
Income Statement
Cash Flow
Balance Sheet
FDS Income Statement
Enable JavaScript and reload
Revenue, Net:
Cost of Goods & Services Sold:
Gross Profit:
Selling, General & Admin Expense:
Research & Development Expense:
Total Operating Expenses:
Operating Income:
Income Taxes:
Net Income:
FDS Cash Flow
Enable JavaScript and reload
Operating Activities Net Income:
Depreciation, Depletion & Amortization:
Change in Accounts Receiveable:
Net Cash from Operations:
Repurchases/Buybacks Common Stock:
Issuance of Long-term Debt:
Cash Dividends Paid:
Net Cash from Financing Activities:
Property, Plant & Equipment Purchases:
Purchases of Businesses, Net of Cash:
Net Cash from Investing Activities:
Net Change in Cash & Equivalents:
FDS Balance Sheet
Enable JavaScript and reload
Cash and Cash Equivalents:
Short-Term Investments:
Accounts Receivable, Net:
Inventories:
Total Current Assets:
Property, Plant & Equipment, Net:
Total Assets:
Accounts Payable:
Current Portion of Long-Term Debt:
Total Short-Term Liabilities:
Long Term Debt, Non-Current Portion:
Total Long-Term Liabilities:
Total Liabilities:
COMPANY PROFILE
2. BASIS OF PRESENTATION
FactSet conducts business globally and is managed on a geographic basis. The accompanying consolidated financial statements include the accounts of the Company and its wholly owned subsidiaries. All intercompany activity and balances have been eliminated from the consolidated financial statements. The presentation of prior year segment operating profit for each of the Company's reportable segments in Note 7 to the Consolidated Statements of Financial Condition has been adjusted to conform to the current year's presentation. These reclassifications between the U.S., Europe and Asia Pacific reportable segments had no effect on the Company's previously reported total operating profit.
The accompanying financial data as of November 30, 2010 and for the three months ended November 30, 2010 and 2009 has been prepared by the Company, without audit, pursuant to the rules and regulations of the Securities and Exchange Commission ("SEC"). Certain information and footnote disclosures normally included in financial statements prepared in accordance with accounting principles generally accepted in the United States have been condensed or omitted pursuant to such rules and regulations. The August 31, 2010 Consolidated Statement of Financial Condition was derived from audited financial statements, but does not include all disclosures required by accounting principles generally accepted in the United States. However, the Company believes that the disclosures are adequate to make the information presented not misleading. These consolidated financial statements should be read in conjunction with Management's Discussion and Analysis of Financial Condition and Results of Operations and the financial statements and notes to them included in the Company's Annual Report on Form 10-K for the fiscal year ended August 31, 2010.
In the opinion of management, the accompanying statements of financial condition and related interim statements of income and cash flows include all normal adjustments in order to present fairly the results of the Company's operations for the periods presented in conformity with accounting principles generally accepted in the United States.
FactSet has performed an evaluation of subsequent events occurring subsequent to the end of the Company's fiscal 2011 first quarter and through the date the consolidated financial statements were issued based on the accounting guidance for subsequent events.
Free historical financial statements for FactSet Research Systems Inc.. See how revenue, income, cash flow, and balance sheet financials have changed over 63 quarters since 2010. Compare with FDS stock chart to see long term trends.
Data imported from FactSet Research Systems Inc. SEC filings. Check original filings before making any investment decision.