Financials › Services-Business Services, Nec

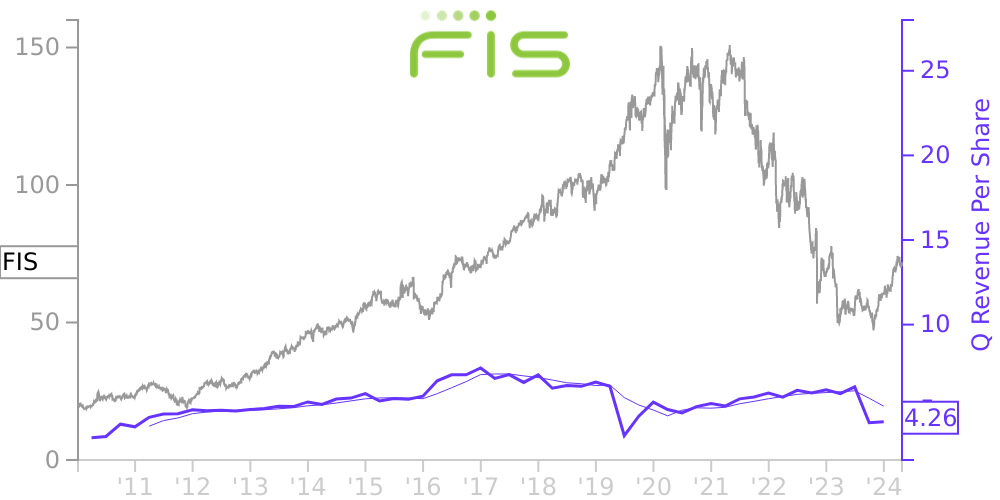
FIS Stock Price Correlated With Fidelity National Information Services Financials
External Links ⌄
Income Statement
Cash Flow
Balance Sheet
FIS Income Statement
Enable JavaScript and reload
Revenue, Net:
Cost of Goods & Services Sold:
Gross Profit:
Selling, General & Admin Expense:
Research & Development Expense:
Total Operating Expenses:
Operating Income:
Income Taxes:
Net Income:
FIS Cash Flow
Enable JavaScript and reload
Operating Activities Net Income:
Depreciation, Depletion & Amortization:
Change in Accounts Receiveable:
Net Cash from Operations:
Repurchases/Buybacks Common Stock:
Issuance of Long-term Debt:
Cash Dividends Paid:
Net Cash from Financing Activities:
Property, Plant & Equipment Purchases:
Purchases of Businesses, Net of Cash:
Net Cash from Investing Activities:
Net Change in Cash & Equivalents:
FIS Balance Sheet
Enable JavaScript and reload
Cash and Cash Equivalents:
Short-Term Investments:
Accounts Receivable, Net:
Inventories:
Total Current Assets:
Property, Plant & Equipment, Net:
Total Assets:
Accounts Payable:
Current Portion of Long-Term Debt:
Total Short-Term Liabilities:
Long Term Debt, Non-Current Portion:
Total Long-Term Liabilities:
Total Liabilities:
COMPANY PROFILE
Basis of Presentation FIS is a leading provider of technology solutions for merchants, banks and capital markets firms globally.
On July 31, 2019, FIS completed the acquisition of Worldpay Inc. ("Worldpay"), and Worldpay's results of operations and financial position are included in the consolidated financial statements from and after the date of acquisition. See Note 3 for additional discussion.
FIS reports its financial performance based on the following segments: Merchant Solutions, Banking Solutions, Capital Market Solutions, and Corporate and Other. The Company regularly assesses its portfolio of assets and reclassified certain non-strategic businesses from the Merchant Solutions, Banking Solutions, and Capital Market Solutions segments into the Corporate and Other segment during the year ended December 31, 2020. These operations represented approximately 3% of 2020 revenue and were recast in all prior-period segment information presented. See Note 21 for a summary of each segment.
Amounts in tables in the financial statements and accompanying footnotes may not sum or calculate due to rounding.
Free historical financial statements for Fidelity National Information Services Inc.. See how revenue, income, cash flow, and balance sheet financials have changed over 65 quarters since 2010. Compare with FIS stock chart to see long term trends.
Data imported from Fidelity National Information Services Inc. SEC filings. Check original filings before making any investment decision.