Health Care › Pharmaceutical Preparations

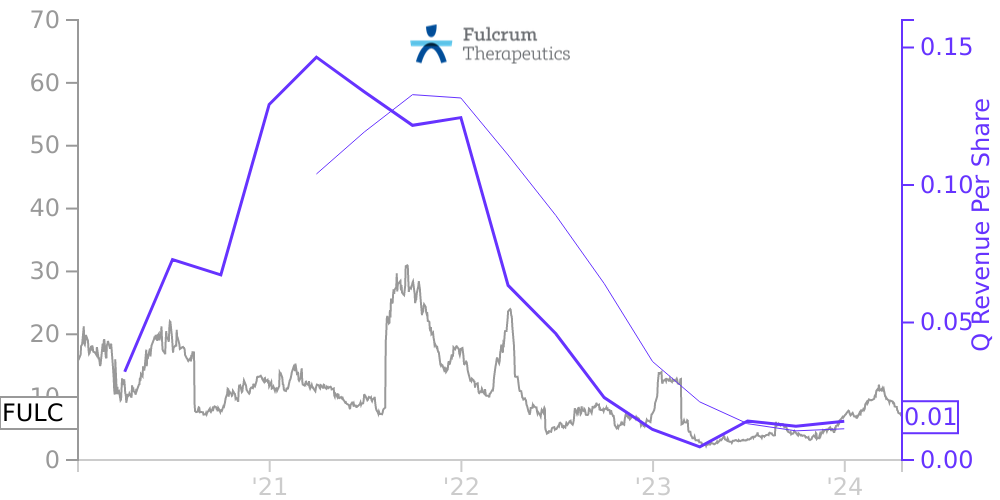
FULC Stock Price Correlated With Fulcrum Therapeutics Financials
External Links ⌄
Income Statement
Cash Flow
Balance Sheet
FULC Income Statement
Enable JavaScript and reload
Revenue, Net:
Cost of Goods & Services Sold:
Gross Profit:
Selling, General & Admin Expense:
Research & Development Expense:
Total Operating Expenses:
Operating Income:
Income Taxes:
Net Income:
FULC Cash Flow
Enable JavaScript and reload
Operating Activities Net Income:
Depreciation, Depletion & Amortization:
Change in Accounts Receiveable:
Net Cash from Operations:
Repurchases/Buybacks Common Stock:
Issuance of Long-term Debt:
Cash Dividends Paid:
Net Cash from Financing Activities:
Property, Plant & Equipment Purchases:
Purchases of Businesses, Net of Cash:
Net Cash from Investing Activities:
Net Change in Cash & Equivalents:
FULC Balance Sheet
Enable JavaScript and reload
Cash and Cash Equivalents:
Short-Term Investments:
Accounts Receivable, Net:
Inventories:
Total Current Assets:
Property, Plant & Equipment, Net:
Total Assets:
Accounts Payable:
Current Portion of Long-Term Debt:
Total Short-Term Liabilities:
Long Term Debt, Non-Current Portion:
Total Long-Term Liabilities:
Total Liabilities:
COMPANY PROFILE
1. Nature of the Business and Basis of Presentation Fulcrum Therapeutics, Inc. (the “Company” or “Fulcrum”) was incorporated in Delaware on August 18, 2015. The Company is focused on improving the lives of patients with genetically-defined rare diseases in areas of high unmet medical need. The Company is subject to a number of risks similar to other companies in the biotechnology industry, including, but not limited to, risks of failure of preclinical studies and clinical trials, dependence on key personnel, protection of proprietary technology, reliance on third party organizations, risks of obtaining regulatory approval for any product candidate that it may develop, development by competitors of technological innovations, compliance with government regulations, and the need to obtain additional financing. Product candidates currently under development will require significant additional research and development efforts, including extensive preclinical and clinical testing, and regulatory approval, prior to commercialization. These efforts require significant amounts of additional capital, adequate personnel infrastructure and extensive compliance-reporting capabilities. Even if the Company’s development efforts are successful, it is uncertain when, if ever, the Company will realize significant revenue from product sales. Basis of Presentation The accompanying consolidated financial statements have been prepared in conformity with generally accepted accounting principles in the United States of America (“GAAP”). Any reference in these notes to applicable guidance is meant to refer to the authoritative GAAP as found in the Accounting Standards Codification (“ASC”) and Accounting Standards Updates (“ASU”) of the Financial Accounting Standards Board (“FASB”). Sales of Common Stock On June 9, 2020, the Company issued and sold 4,029,411 shares of common stock to investors in a private placement at a price of $ 17.00 per share, resulting in net proceeds of $ 64.3 million after deducting offering costs. On August 11, 2020, the Company entered into an Equity Distribution Agreement with Piper Sandler & Co. (“Piper Sandler”), as sales agent, pursuant to which the Company may offer and sell shares of its common stock with an aggregate offering price of up to $ 75.0 million under an “at-the-market” offering program (the “ATM Offering”). The Equity Distribution Agreement provides that Piper Sandler will be entitled to a sales commission equal to 3.0 % of the gross sales price per share of all shares sold under the ATM Offering. From the initiation of the ATM Offering through December 31, 2021, the Company has issued and sold 550,000 shares under the ATM Offering, resulting in aggregate net proceeds of $ 5.7 million after deducting issuance costs of $ 0.2 million. On January 22, 2021, the Company completed a public offering of its common stock and issued and sold 4,600,000 shares of common stock at a public offering price of $ 11.00 per share, resulting in net proceeds of $ 47.4 million after deducting underwriting discounts and commissions and offering expenses. On August 16, 2021, the Company completed a public offering of its common stock and issued and sold 7,590,000 shares of common stock at a public offering price of $ 19.00 per share, resulting in net proceeds of $ 135.5 million after deducting underwriting discounts and commissions and offering expenses. Liquidity The Company has incurred recurring losses and negative cash flows from operations since inception and has primarily funded its operations with proceeds from the sale of shares of common stock in public offerings, a private placement, and the ATM Offering, through issuances of convertible preferred stock, and from upfront payments received from the collaboration and license agreements with Acceleron Pharma Inc. (“Acceleron”), a wholly-owned subsidiary of Merck & Co., Inc., and MyoKardia, Inc. (“MyoKardia”), a wholly-owned subsidiary of Bristol Myers Squibb Company. As of D
Free historical financial statements for Fulcrum Therapeutics Inc. See how revenue, income, cash flow, and balance sheet financials have changed over 25 quarters since 2020. Compare with FULC stock chart to see long term trends.
Data imported from Fulcrum Therapeutics Inc SEC filings. Check original filings before making any investment decision.