Communication › Services-Motion Picture And Video Tape Production

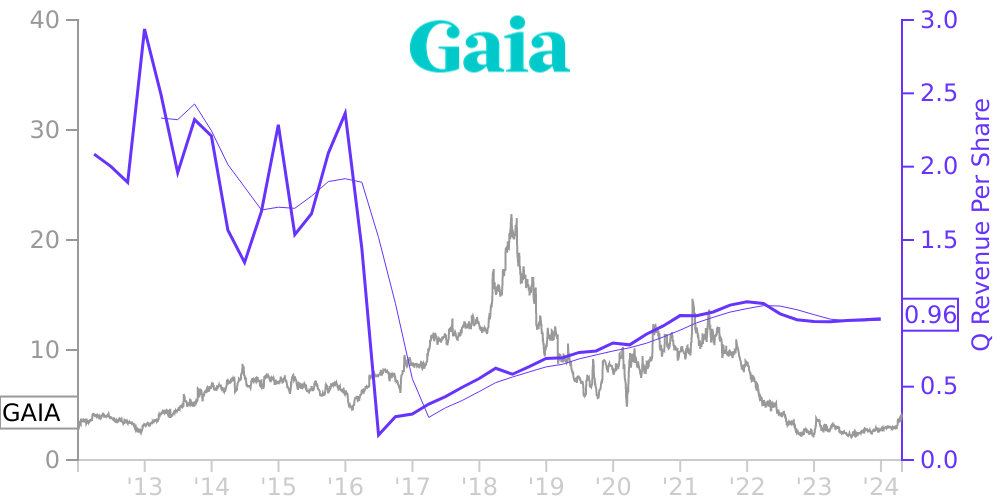
GAIA Stock Price Correlated With Gaia Financials
External Links ⌄
Income Statement
Cash Flow
Balance Sheet
GAIA Income Statement
Enable JavaScript and reload
Revenue, Net:
Cost of Goods & Services Sold:
Gross Profit:
Selling, General & Admin Expense:
Research & Development Expense:
Total Operating Expenses:
Operating Income:
Income Taxes:
Net Income:
GAIA Cash Flow
Enable JavaScript and reload
Operating Activities Net Income:
Depreciation, Depletion & Amortization:
Change in Accounts Receiveable:
Net Cash from Operations:
Repurchases/Buybacks Common Stock:
Issuance of Long-term Debt:
Cash Dividends Paid:
Net Cash from Financing Activities:
Property, Plant & Equipment Purchases:
Purchases of Businesses, Net of Cash:
Net Cash from Investing Activities:
Net Change in Cash & Equivalents:
GAIA Balance Sheet
Enable JavaScript and reload
Cash and Cash Equivalents:
Short-Term Investments:
Accounts Receivable, Net:
Inventories:
Total Current Assets:
Property, Plant & Equipment, Net:
Total Assets:
Accounts Payable:
Current Portion of Long-Term Debt:
Total Short-Term Liabilities:
Long Term Debt, Non-Current Portion:
Total Long-Term Liabilities:
Total Liabilities:
COMPANY PROFILE
1. Organization, Nature of Operations, and Principles of Consolidation
Gaia, Inc. operates a global digital video subscription service and on-line community that caters to a unique and underserved member base. Our digital content is available to our members on most internet-connected devices anytime, anywhere commercial free. Through our online Gaia subscription service, our members have unlimited access to a vast library of inspiring films, cutting edge documentaries, interviews, yoga classes, transformation related content, and more – exclusively available to our members for digital streaming. A subscription also allows our members to download and view files from our library without being actively connected to the internet. We were incorporated under the laws of the State of Colorado on July 7, 1988.
In December 2021, we completed our acquisition of Yoga International, Inc. (“Yoga International”) as discussed further in Note 4. The acquisition of Yoga International has expanded our offerings to include a stand-alone subscription yoga service and expanded our content offering with over 4,000 hours of unique content tailored to yoga consumers interested in the philosophy and lifestyle of yoga.
We have prepared the accompanying consolidated financial statements in accordance with accounting principles generally accepted in the United States, or GAAP, and they include our accounts and those of our subsidiaries, over which we exercise control. Intercompany transactions and balances have been eliminated.
Free historical financial statements for Gaia Inc. See how revenue, income, cash flow, and balance sheet financials have changed over 57 quarters since 2012. Compare with GAIA stock chart to see long term trends.
Data imported from Gaia Inc SEC filings. Check original filings before making any investment decision.