Consumer Staples › Grain Mill Products

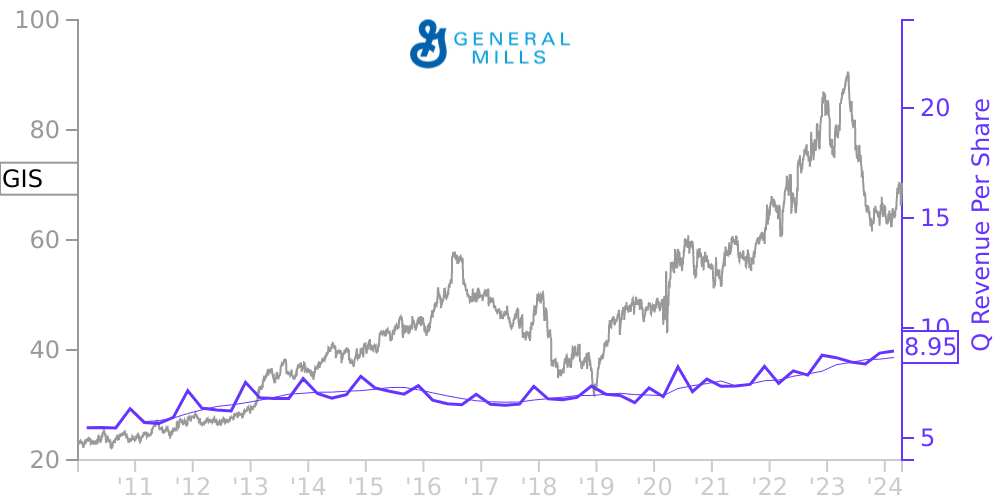
GIS Stock Price Correlated With General Mills Financials
External Links ⌄
Income Statement
Cash Flow
Balance Sheet
GIS Income Statement
Enable JavaScript and reload
Revenue, Net:
Cost of Goods & Services Sold:
Gross Profit:
Selling, General & Admin Expense:
Research & Development Expense:
Total Operating Expenses:
Operating Income:
Income Taxes:
Net Income:
GIS Cash Flow
Enable JavaScript and reload
Operating Activities Net Income:
Depreciation, Depletion & Amortization:
Change in Accounts Receiveable:
Net Cash from Operations:
Repurchases/Buybacks Common Stock:
Issuance of Long-term Debt:
Cash Dividends Paid:
Net Cash from Financing Activities:
Property, Plant & Equipment Purchases:
Purchases of Businesses, Net of Cash:
Net Cash from Investing Activities:
Net Change in Cash & Equivalents:
GIS Balance Sheet
Enable JavaScript and reload
Cash and Cash Equivalents:
Short-Term Investments:
Accounts Receivable, Net:
Inventories:
Total Current Assets:
Property, Plant & Equipment, Net:
Total Assets:
Accounts Payable:
Current Portion of Long-Term Debt:
Total Short-Term Liabilities:
Long Term Debt, Non-Current Portion:
Total Long-Term Liabilities:
Total Liabilities:
COMPANY PROFILE
Notes to Consolidated Financial Statements
GENERAL MILLS, INC. AND SUBSIDIARIES
NOTE 1 . BASIS OF PRESENTATION AND RECLASSIFICATIONS Basis of Presentation Our Consolidated Financial Statements include the accounts of General Mills, Inc. and all subsidiaries in which we have a controlling financial interest. Intercompany transactions and accounts are eliminated in consolidation. Our fiscal year ends on the last Sunday in May. Fiscal 2010 and 2008 each consisted of 52 weeks, and fiscal 2009 consisted of 53 weeks. In December 2007, the F inancial Accounting Standards Board (F ASB ) issued new guidance on noncontrolling interes ts in financial statements. The guidance establishes accounting and reporting standards that require: the ownership interest in subsidiaries held by parties other than the parent to be clearly identified and presented in the Consolidated Balance Sheets within equity, but separate from the parent's equity; the amount of consolidated net earnings attributable to the parent and the noncontrolling interest to be clearly identified and presented on the face of the Consolidated Statement s of Earnings; and changes in a parent's ownership interest while the parent retains its controlling financial interest in its subsidiary to be accounted for consistently. We adopted the guidance at the beginning of fiscal 2010 . To conform to the current period presentation, we made the following reclassifi cations to net earnings attributable to noncontrolling interests in our Consolidated Statement s of Earnings : Fiscal Year In Millions 2009 2008 From interest, net $ 7.2 $ 22.0 From selling, general, and administrative (SG&A) expenses 2.1 1.4 Total net earnings attributable to noncontrolling interests $ 9.3 $ 23.4
Also, noncontrolling interests previously reported as minority interests have been reclassified to a separate section in equity on the Consolidated Balance Sheets as a result of the adoption . In addition, certain other reclassifications to our previously reported financial information have been made to conform to the current period presentation. In May 2010 , our Board of Directors approved a two-for-one stock split to be effected in the form of a 100 percent stock dividend to stockholders of record on May 28, 2010. The Company's stockholders received one additional share of common stock for each share of common stock in their possession on that date. The additional shares were distributed on June 8, 2010. This did not change the proportionate interest that a stockholder maintained in the Company. All shares and per share amounts have been adjusted for the two-for-one stock split throughout this report . Change in Reporting Period As part of a long-term plan to conform the fiscal year ends of all our operations, we have changed the reporting period of certain countries with in our International segment from an April fiscal year end to a May fiscal year end to match our fiscal calendar. Accordingly, in the year of change, our results include 13 months of results from the affected operations compared to 12 months in previous fiscal years . In fiscal 2010 , we changed many of the countries in our Asia/Pacific region , and in fiscal 2009 we changed most countries in our Latin America region. The impact of these change s w as not material to our results of operations and, therefore, we did not restate prior period financial statements for comparability. Countries within the International segment that remain on an April fiscal year end include our European operations and China.
Free historical financial statements for General Mills Inc. See how revenue, income, cash flow, and balance sheet financials have changed over 68 quarters since 2009. Compare with GIS stock chart to see long term trends.
Data imported from General Mills Inc SEC filings. Check original filings before making any investment decision.