Financials › Insurance Agents Brokers And Services

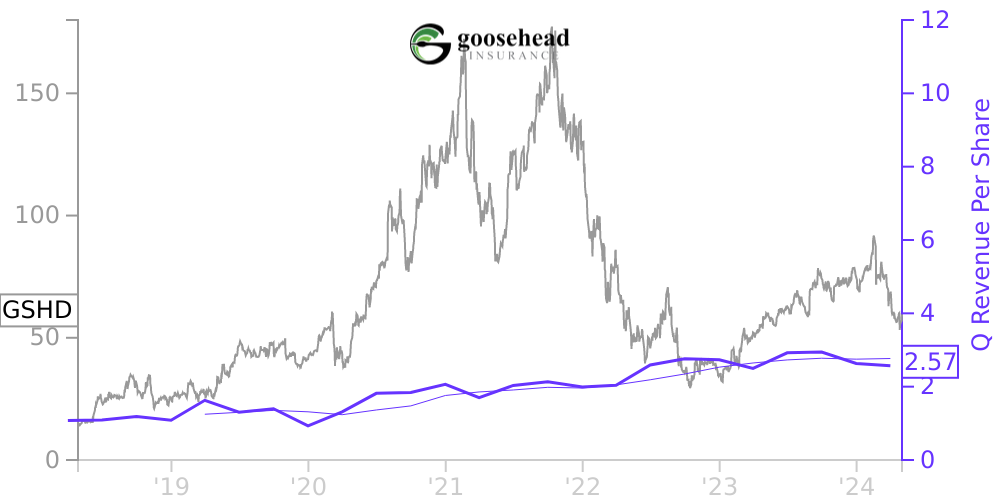
GSHD Stock Price Correlated With Goosehead Insurance Financials
External Links ⌄
Income Statement
Cash Flow
Balance Sheet
GSHD Income Statement
Enable JavaScript and reload
Revenue, Net:
Cost of Goods & Services Sold:
Gross Profit:
Selling, General & Admin Expense:
Research & Development Expense:
Total Operating Expenses:
Operating Income:
Income Taxes:
Net Income:
GSHD Cash Flow
Enable JavaScript and reload
Operating Activities Net Income:
Depreciation, Depletion & Amortization:
Change in Accounts Receiveable:
Net Cash from Operations:
Repurchases/Buybacks Common Stock:
Issuance of Long-term Debt:
Cash Dividends Paid:
Net Cash from Financing Activities:
Property, Plant & Equipment Purchases:
Purchases of Businesses, Net of Cash:
Net Cash from Investing Activities:
Net Change in Cash & Equivalents:
GSHD Balance Sheet
Enable JavaScript and reload
Cash and Cash Equivalents:
Short-Term Investments:
Accounts Receivable, Net:
Inventories:
Total Current Assets:
Property, Plant & Equipment, Net:
Total Assets:
Accounts Payable:
Current Portion of Long-Term Debt:
Total Short-Term Liabilities:
Long Term Debt, Non-Current Portion:
Total Long-Term Liabilities:
Total Liabilities:
COMPANY PROFILE
Organization Goosehead Insurance, Inc. (“GSHD”) is the sole managing member of Goosehead Financial, LLC (“GF”) and has the sole voting power and control of management of GF. Accordingly, GSHD consolidates the financial results of GF and reports non-controlling interest in GSHD’s condensed consolidated financial statements.
GF was organized on January 1, 2016 as a Delaware Limited Liability Company and is headquartered in Westlake, TX.
GSHD (collectively with its consolidated subsidiaries, the “Company”) provides personal and commercial property and casualty insurance brokerage services for its clients through a network of corporate-owned agencies and franchise units across the nation.
The Company had 15 and 10 corporate-owned locations in operation at March 31, 2022 and 2021, respectively. Franchisees are provided access to insurance Carrier Appointments, product training, technology infrastructure, client service centers and back office services. During the three months ended March 31, 2022 and 2021, the Company onboarded 113 and 117 franchise locations, respectively, and had 1,268 and 987 operating franchise locations as of March 31, 2022 and 2021, respectively. No franchises were purchased by the Company during the three months ended March 31, 2022 or 2021.
All intercompany accounts and transactions have been eliminated in consolidation.
Free historical financial statements for Goosehead Insurance Inc. See how revenue, income, cash flow, and balance sheet financials have changed over 34 quarters since 2018. Compare with GSHD stock chart to see long term trends.
Data imported from Goosehead Insurance Inc SEC filings. Check original filings before making any investment decision.