Communication › Television Broadcasting Stations

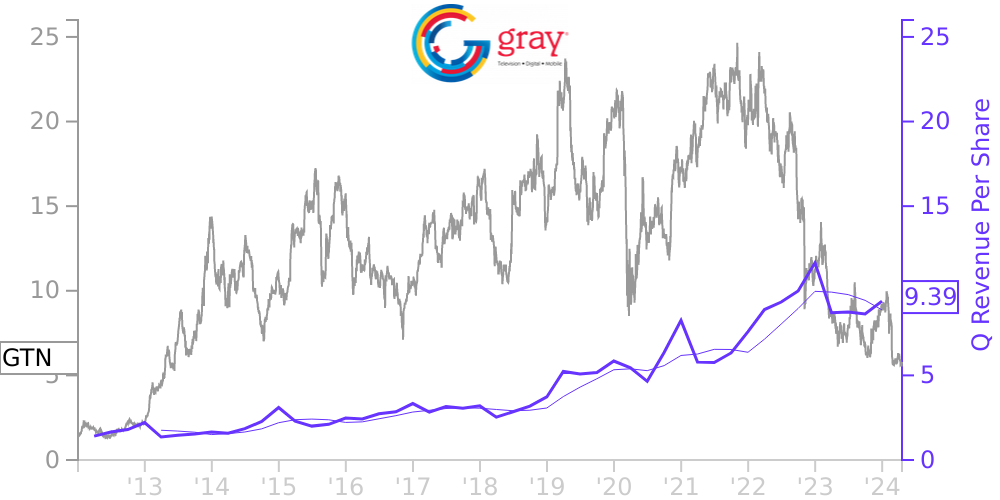
GTN Stock Price Correlated With Gray Television Financials
External Links ⌄
Income Statement
Cash Flow
Balance Sheet
GTN Income Statement
Enable JavaScript and reload
Revenue, Net:
Cost of Goods & Services Sold:
Gross Profit:
Selling, General & Admin Expense:
Research & Development Expense:
Total Operating Expenses:
Operating Income:
Income Taxes:
Net Income:
GTN Cash Flow
Enable JavaScript and reload
Operating Activities Net Income:
Depreciation, Depletion & Amortization:
Change in Accounts Receiveable:
Net Cash from Operations:
Repurchases/Buybacks Common Stock:
Issuance of Long-term Debt:
Cash Dividends Paid:
Net Cash from Financing Activities:
Property, Plant & Equipment Purchases:
Purchases of Businesses, Net of Cash:
Net Cash from Investing Activities:
Net Change in Cash & Equivalents:
GTN Balance Sheet
Enable JavaScript and reload
Cash and Cash Equivalents:
Short-Term Investments:
Accounts Receivable, Net:
Inventories:
Total Current Assets:
Property, Plant & Equipment, Net:
Total Assets:
Accounts Payable:
Current Portion of Long-Term Debt:
Total Short-Term Liabilities:
Long Term Debt, Non-Current Portion:
Total Long-Term Liabilities:
Total Liabilities:
COMPANY PROFILE
1. Description of Business and Summary of Significant Accounting Policies
Overview. We are a multimedia company headquartered in Atlanta, Georgia. We are the nation’s largest owner of top-rated local television stations and digital assets in the United States. Our television stations serve 113 television markets that collectively reach approximately 36 percent of US television households. This portfolio includes 80 markets with the top-rated television station and 100 markets with the first and/or second highest rated television station. We also own video program companies Raycom Sports, Tupelo Honey, PowerNation Studios and Third Rail Studios.
Investments in Broadcasting, Production and Technology Companies. We have investments in several television, production and technology companies. We account for all material investments in which we have significant influence over the investee under the equity method of accounting. Upon initial investment, we record equity method investments at cost. The amounts initially recognized are subsequently adjusted for our appropriate share of the net earnings or losses of the investee. We record any investee losses up to the carrying amount of the investment plus advances and loans made to the investee, and any financial guarantees made on behalf of the investee. We recognize our share in earnings and losses of the investee as miscellaneous (expense) income, net in our consolidated statements of operations. Investments are also increased by contributions made to and decreased by the distributions from the investee. The Company evaluates equity method investments for impairment whenever events or changes in circumstances indicate that the carrying amounts of such investments may be impaired.
Investments in non-public businesses that do not have readily determinable pricing, and for which the Company does not have control or does not exert significant influence, are carried at cost less impairments, if any, plus or minus changes in observable prices for those investments. Gains or losses resulting from changes in the carrying value of these investments are included as miscellaneous (expense) income, net in our consolidated statements of operations. These investments are reported together as a non-current asset on our consolidated balance sheets.
Use of Estimates. The preparation of financial statements in conformity with accounting principles generally accepted in the United States of America (“United States GAAP”, or “GAAP”) requires management to make estimates and assumptions that affect the amounts reported in the financial statements and accompanying notes. Our actual results could differ materially from these estimated amounts. Our most significant estimates are our allowance for credit losses in receivables, valuation of goodwill and intangible assets, amortization of program rights and intangible assets, pension costs, income taxes, employee medical insurance claims, useful lives of property and equipment and contingencies.
Allowance for Credit Losses. We are exposed to credit risk primarily through sales of broadcast and digital advertising with a variety of direct and agency-based advertising customers, retransmission consent agreements with multichannel video program distributors and program production sales and services. We recorded expenses for this allowance of $4 million, $2 million and $11 million for the years ended December 31, 2021, 2020 and 2019, respectively.
Our allowance for credit losses is an estimate of expected losses over the remaining contractual life of our receivables based on an ongoing analysis of collectability, historical collection experience, current economic and industry conditions and reasonable and supportable forecasts. The allowance is calculated using a historical loss rate applied to the current aging analysis. We may also apply additional allowance when warranted by specific facts and circumstances. We generally write off account receivable
Free historical financial statements for Gray Television Inc. See how revenue, income, cash flow, and balance sheet financials have changed over 57 quarters since 2012. Compare with GTN stock chart to see long term trends.
Data imported from Gray Television Inc SEC filings. Check original filings before making any investment decision.