Financials › Investment Advice

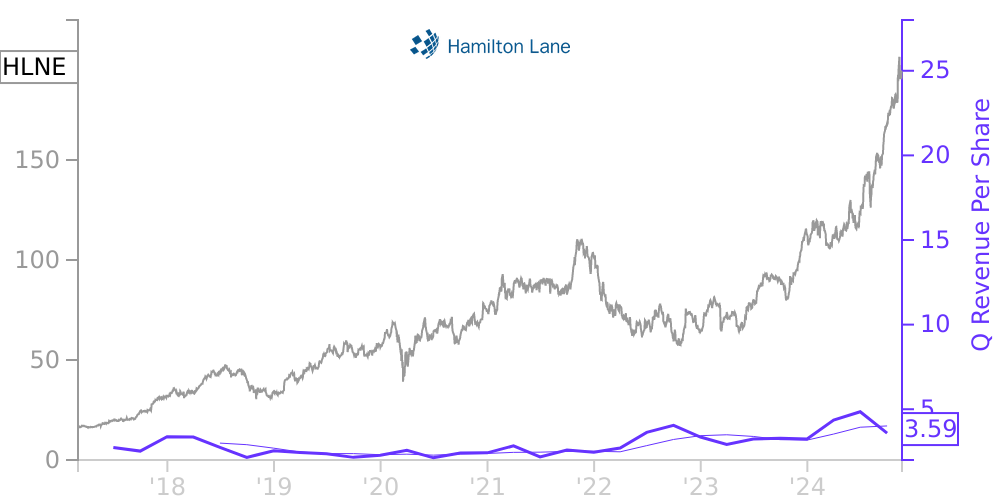
HLNE Stock Price Correlated With Hamilton Lane Financials
External Links ⌄
Income Statement
Cash Flow
Balance Sheet
HLNE Income Statement
Enable JavaScript and reload
Revenue, Net:
Cost of Goods & Services Sold:
Gross Profit:
Selling, General & Admin Expense:
Research & Development Expense:
Total Operating Expenses:
Operating Income:
Income Taxes:
Net Income:
HLNE Cash Flow
Enable JavaScript and reload
Operating Activities Net Income:
Depreciation, Depletion & Amortization:
Change in Accounts Receiveable:
Net Cash from Operations:
Repurchases/Buybacks Common Stock:
Issuance of Long-term Debt:
Cash Dividends Paid:
Net Cash from Financing Activities:
Property, Plant & Equipment Purchases:
Purchases of Businesses, Net of Cash:
Net Cash from Investing Activities:
Net Change in Cash & Equivalents:
HLNE Balance Sheet
Enable JavaScript and reload
Cash and Cash Equivalents:
Short-Term Investments:
Accounts Receivable, Net:
Inventories:
Total Current Assets:
Property, Plant & Equipment, Net:
Total Assets:
Accounts Payable:
Current Portion of Long-Term Debt:
Total Short-Term Liabilities:
Long Term Debt, Non-Current Portion:
Total Long-Term Liabilities:
Total Liabilities:
COMPANY PROFILE
Organization Hamilton Lane Incorporated (“HLI”) was incorporated in the State of Delaware on December 31, 2007 and, following its 2017 initial public offering, is a holding company whose principal asset is a controlling equity interest in Hamilton Lane Advisors, L.L.C. (“HLA”). As the sole managing member of HLA, HLI operates and controls all of the business and affairs of HLA, and through HLA, conducts its business. As a result, HLI consolidates HLA’s financial results and reports a non-controlling interest related to the portion of HLA units not owned by HLI. The assets and liabilities of HLA represent substantially all of HLI’s consolidated assets and liabilities with the exception of certain cash, certain deferred tax assets and liabilities, payable to related parties pursuant to a tax receivable agreement, and dividends payable. Unless otherwise specified, “the Company” refers to the consolidated entity of HLI, HLA and subsidiaries throughout the remainder of these notes. As of March 31, 2021 and 2020, HLI held approximately 67.2% and 55.1%, respectively, of the economic interest in HLA. As future exchanges of HLA units occur pursuant to the exchange agreement in place with HLA’s members, the economic interest in HLA held by HLI will increase.
HLA is a registered investment advisor with the United States Securities and Exchange Commission (“SEC”), providing asset management and advisory services, primarily to institutional investors, to design, build and manage private markets portfolios. HLA generates revenues primarily from management fees, by managing assets on behalf of customized separate accounts, specialized fund products and distribution management accounts, and advisory fees, by providing asset supervisory and reporting services. HLA sponsors the formation, and serves as the general partner or managing member, of various limited liability partnerships consisting of specialized funds and certain single client separate account entities (“Partnerships”) that acquire interests in third-party managed investment funds that make private equity and equity-related investments. The Partnerships may also make direct co-investments, including investments in debt, equity, and other equity-based instruments. The Company, which includes certain subsidiaries that serve as the general partner or managing member of the Partnerships, may invest its own capital in the Partnerships and generally makes all investment and operating decisions for the Partnerships. HLA operates several wholly owned entities through which it conducts its foreign operations.
HLA is a registered investment advisor with the United States Securities and Exchange Commission (“SEC”), providing asset management and advisory services, primarily to institutional investors, to design, build and manage private markets portfolios. HLA generates revenues primarily from management fees, by managing assets on behalf of customized separate accounts, specialized fund products and distribution management accounts, and advisory fees, by providing asset supervisory and reporting services. HLA sponsors the formation, and serves as the general partner or managing member, of various limited liability partnerships consisting of specialized funds and certain single client separate account entities (“Partnerships”) that acquire interests in third-party managed investment funds that make private equity and equity-related investments. The Partnerships may also make direct co-investments, including investments in debt, equity, and other equity-based instruments. The Company, which includes certain subsidiaries that serve as the general partner or managing member of the Partnerships, may invest its own capital in the Partnerships and generally makes all investment and operating decisions for the Partnerships. HLA operates several wholly owned entities through which it conducts its foreign operations.
Free historical financial statements for Hamilton Lane Inc. See how revenue, income, cash flow, and balance sheet financials have changed over 36 quarters since 2017. Compare with HLNE stock chart to see long term trends.
Data imported from Hamilton Lane Inc SEC filings. Check original filings before making any investment decision.