Health Care › X-Ray Apparatus And Tubes And Related Irradiation Apparatus

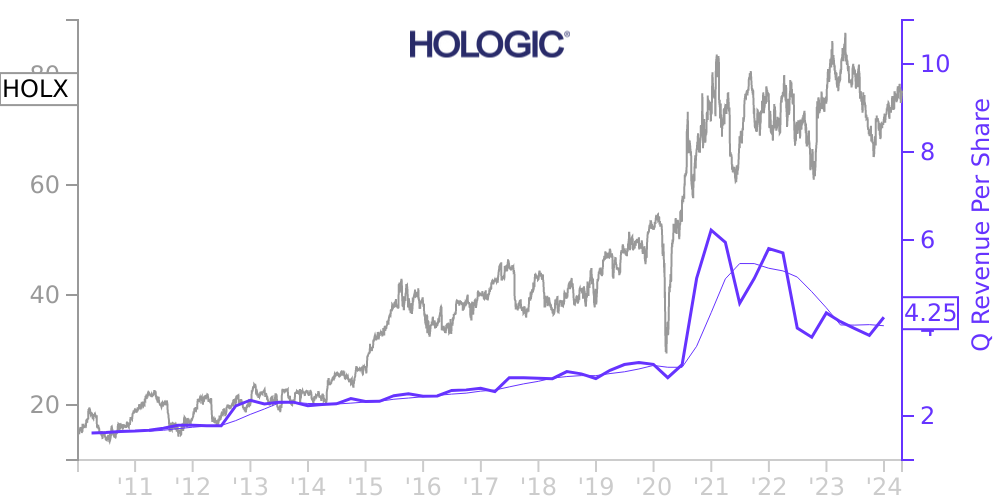
HOLX Stock Price Correlated With Hologic Financials
External Links ⌄
Income Statement
Cash Flow
Balance Sheet
HOLX Income Statement
Enable JavaScript and reload
Revenue, Net:
Cost of Goods & Services Sold:
Gross Profit:
Selling, General & Admin Expense:
Research & Development Expense:
Total Operating Expenses:
Operating Income:
Income Taxes:
Net Income:
HOLX Cash Flow
Enable JavaScript and reload
Operating Activities Net Income:
Depreciation, Depletion & Amortization:
Change in Accounts Receiveable:
Net Cash from Operations:
Repurchases/Buybacks Common Stock:
Issuance of Long-term Debt:
Cash Dividends Paid:
Net Cash from Financing Activities:
Property, Plant & Equipment Purchases:
Purchases of Businesses, Net of Cash:
Net Cash from Investing Activities:
Net Change in Cash & Equivalents:
HOLX Balance Sheet
Enable JavaScript and reload
Cash and Cash Equivalents:
Short-Term Investments:
Accounts Receivable, Net:
Inventories:
Total Current Assets:
Property, Plant & Equipment, Net:
Total Assets:
Accounts Payable:
Current Portion of Long-Term Debt:
Total Short-Term Liabilities:
Long Term Debt, Non-Current Portion:
Total Long-Term Liabilities:
Total Liabilities:
COMPANY PROFILE
Operations Hologic, Inc. (the “Company” or “Hologic”) develops, manufactures and supplies premium diagnostics products, medical imaging systems, and surgical products with an emphasis on women's health and well-being through early detection and treatment. Until December 30, 2019, the Company's product portfolio included light-based aesthetic and medical treatment systems sold by its former Medical Aesthetics business. The Company completed the sale of its Medical Aesthetics segment on December 30, 2019 (the first day of the second quarter of fiscal 2020).
COVID-19 Considerations
The global COVID-19 pandemic has created significant volatility, uncertainty, and economic disruption in the markets the Company sells its products into, primarily the U.S., Europe and Asia-Pacific. Starting in the second quarter of fiscal 2020, the spread of COVID-19 negatively impacted business and healthcare activity globally. In particular, due to government measures, elective procedures and exams were delayed or cancelled, there were significant reductions in physician office visits, and hospitals postponed or canceled capital purchases as well as limited or eliminated services; however, in the second half of the third quarter of fiscal 2020, the Company started to see a recovery of elective procedures and exams as economies were opened back up and restrictions eased, which has continued through the fourth quarter of fiscal 2021. The reductions in testing and procedures had a negative impact on the Company's operating results and cash flows in fiscal 2020, however, the impact of the commercial release of its COVID-19 assays more than offset those negative impacts as the Company generated significant revenue from the sales of these assays starting in the third quarter of fiscal 2020 through the fourth quarter of fiscal 2021.
While the Company's results of operations and cash flows since the third quarter of fiscal 2020 have been positively impacted by the sale of its COVID-19 assays as well the continued recovery of its other primary product lines and businesses to pre-COVID levels, the COVID-19 pandemic could have an adverse impact on its operating results, cash flows and financial condition in the future. The factors that could create such adverse impact include: reduced demand for COVID-19 testing; competition from existing and new COVID-19 testing technologies and products as well as the timing and effectiveness of distributing vaccines; the severity and duration of the COVID-19 pandemic; the resurgence of COVID-19 infections; the emergence of new COVID strain variants; the COVID-19 pandemic's impact on the U.S. and international healthcare systems, the U.S. economy and worldwide economy; and the timing, scope and effectiveness of U.S. and international governmental, regulatory, fiscal, monetary and public health responses to the COVID-19 pandemic and associated economic disruptions. The Company expects that as the current COVID-19 pandemic subsides, there may be a significantly reduced demand for ongoing testing, and thus, for its COVID-19 assays. As expected in the third quarter of fiscal 2021, revenues generated from the sale of its COVID-19 assays decreased significantly in the U.S. compared to the prior year period and the first and second quarters of fiscal 2021 as the population of vaccinated people continues to grow in the U.S. In the fourth quarter of fiscal 2021, COVID-19 assay revenues increased compared to the preceding quarter primarily due to the impact of the delta strain of COVID-19 resulting in higher demand for testing, however COVID-19 assay revenues decreased compared to the corresponding prior year period.
In response to the negative impact of COVID-19 on the Company's business, in April 2020, the Company initiated cost-cutting measures, which included not only reducing discretionary and variable spend, such as travel, marketing programs and the use of contractors, consultants and temporary help, but the Company also im
Free historical financial statements for Hologic Inc. See how revenue, income, cash flow, and balance sheet financials have changed over 65 quarters since 2009. Compare with HOLX stock chart to see long term trends.
Data imported from Hologic Inc SEC filings. Check original filings before making any investment decision.